Vector Data General Properties
The General page contains the properties for the point vector data. 3D point vector data is displayed for post and classed post layers and for base (vector) layers that include point features. Select a Post, Classed Post, or Base layer in the Vector Data group in the 3D view window to edit the point vector data properties.
|
|
|
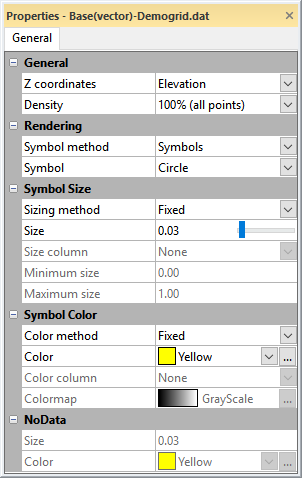
Select the Z coordinates and modify the scatterplot appearance on the General page. |
General
The General section includes the properties for the Z coordinates and point density.
Z Coordinates
Select the Z coordinates for the in the Z coordinates field. The Z coordinates list includes data columns for post and classed post layers. The Z coordinates list includes attributes from the base layer with numeric or mixed data. Attributes that include only text data are not included in the Z coordinates list.
The default Z coordinate selection depends on the attribute names. First, Surfer searches for a ZLEVEL attribute, next for an Elevation attribute, and finally for a Z attribute. If no attributes are found matching any of the default names, no attribute is selected by default.
Density
The Density property specifies the number of displayed points. Select a value from the Density list to plot between 1% and 100% of points: 100% (all points), 50% (every other point), 33% (every 3rd point), 25% (every 4th point), 20% (every 5th point), 10% (every 10th point), 5% (every 20th point), or 1% (every 100th point).
Rendering
The Rendering section includes properties that specify the style of the symbols.
Symbol Method
The Symbol method property defines the style of the point vector data symbols. Select Symbols in the Symbol method list to display the points as circles, squares, spheres, or cubes. Select Same as plot to display the points with the same symbol style as found the in map in the plot window.
Symbol
The Symbol property specifies the symbol style when the Symbol method property is set to Symbols. Select Circle, Square, Cube, or Sphere from the list. The Circle and Square are two dimensional symbols. The Cube and Sphere are three dimensional symbols.
Symbol Size
The Symbol Size section includes properties for setting the symbol size based on the plot, to a fixed value, or by proportional scaling.
Sizing Method
The Sizing method specifies the point vector data symbol size. Select the desired Sizing method from the list:
- Same as plot uses the same size symbols as the symbols in the map in the plot window.
- Fixed size uses the same size symbols throughout the 3D view. The Size property is available when the Sizing method is set to Fixed.
- Proportional uses different sized symbols for the point vector data based on a data value. The Size column, Minimum size, and Maximum size properties are available when the Sizing method is set to Proportional. The Proportional option uses linear scaling between the data minimum and maximum. For more scaling options, use the proportional scaling options in 2D map layers and set the Sizing method to Same as plot.
Size
The Size property is available when the Sizing method is set to Fixed. The Size property sets the size of the fixed symbols. Click and drag the slider  to the left to decrease the Size value, or drag the slider to the right to increase the Size value.
Size Column
Select the data column or attribute for scaling the symbol sizes in the Size column. The Size column list includes data columns for post and classed post layers. The Size column list includes attributes from the base layer with numeric or mixed data. Attributes that include only text data are not included in the Size column list.
If a mixed data column is selected, point vector data with text data will not be displayed.
Minimum Size
Specify the size of the symbol that corresponds to the smallest data value in the Minimum size property. Set the Minimum size to a value between 0.00 and 1.00.
Maximum Size
Specify the size of the symbol that corresponds to the largest data value in the Maximum size property. Set the Maximum size to a value between 0.00 and 1.00.
Symbol Color
The Symbol Color section includes properties for coloring the symbols based on the plot, to a specific fixed color, or by a colormap.
Color Method
The Color method property specifies the symbol color for the point vector data:
- Same as plot uses the same symbol color(s) as the symbols in the map in the plot window.
- Fixed uses the same symbol fill color throughout. The Color property is available when the Color method is set to Fixed.
- By colormap assigns colors to the symbols based on a data value and colormap. The Color column and Colormap properties are available when the Color method is set to By colormap. If the post, classed post, or base (vector) layer already assigns colors by a colormap, you may wish to set the Color method to Same as plot.
Color
The Color property specifies the symbol color when the Color method is set to Fixed. Select a fill color for the scatter plot by clicking the current Color and selecting the desired color in the color palette. Click the  button to define a custom color in the Colors dialog.
Color Column
Select the data column or attribute for the colormap in the Color column field. The Color column list includes data columns for post and classed post layers. The Color column list includes attributes from the base layer with numeric or mixed data. Attributes that include only text data are not included in the Color column list.
If a mixed data column is selected, points with text data will be displayed in Black in the scatterplot.
Colormap
The Colormap is the color spectrum that is mapped to the Color column data values. Select a predefined colormap from the Colormap list, or click the to modify or create a colormap in the Colormap Editor.
NoData
The NoData section includes properties for specifying the size or color of points where the Size column and/or Color column do not include data. Specify the NoData symbol size in the Size field. Specify the NoData symbol color in the Color field.