Contour Map General Properties
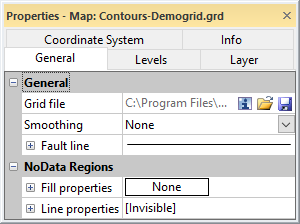
The contour map properties General page controls the Grid file, Smoothing, Fault line properties, and Blanked Regions for a contour map. To open the General page, click on a contour map to select it. In the Properties window, click on the General tab.
|
|
|
Change contour map properties in the Properties window on the General page. |
General
Input Grid File
The Grid file lists the current grid file used in the contour map. The path and file name are the location of the grid file when the map was created or the grid file was most recently changed.
Grid Information
The ![]() button displays information about the grid file used to produce the map layer. The information includes the grid size, the minimum and maximum X, Y, Z, and C values contained in the grid file, and statistics. If the grid file contains more than 40 million nodes, you are asked if you wish to create a detailed report or a quick report. Click Yes in the message to create a detailed grid report, or click No to create a shorter quick grid report.
button displays information about the grid file used to produce the map layer. The information includes the grid size, the minimum and maximum X, Y, Z, and C values contained in the grid file, and statistics. If the grid file contains more than 40 million nodes, you are asked if you wish to create a detailed report or a quick report. Click Yes in the message to create a detailed grid report, or click No to create a shorter quick grid report.
Change File
The ![]() button displays the Open Grid dialog. This allows you to select a new grid file, or an updated version of the grid file used to create the contour map. Select a grid file and click Open. If the Z range for the new grid is outside the old contour levels, you will be prompted to continue the operation. If you clickCancel, the grid file is not replaced. If you clickOK, the grid file is replaced, but no contour lines are drawn. You can update the contour levels being displayed on theLevelstab.
button displays the Open Grid dialog. This allows you to select a new grid file, or an updated version of the grid file used to create the contour map. Select a grid file and click Open. If the Z range for the new grid is outside the old contour levels, you will be prompted to continue the operation. If you clickCancel, the grid file is not replaced. If you clickOK, the grid file is replaced, but no contour lines are drawn. You can update the contour levels being displayed on theLevelstab.
If the new grid exceeds the current map limits, another warning will appear asking you to adjust the map limits. If you click Yes, the limits are automatically adjusted to fit the new grid. If you click No, the limits are not automatically adjusted. The map may not be displayed. To change the map limits, click on the Map object in the Contents window and the Limits tab in the Properties window.
You may also see a warning message that the current map scale may result in an un-viewable map. Clicking OK allows the map scale to automatically be adjusted.
Coordinate System Note:
Regardless of the file selected with either the File | Reload Map Data command or by clicking the ![]() button in the Properties window, the coordinate system for the original map layer is used after updating the file. If this is not the correct coordinate system, click on the map layer to select it. In the Properties window, click on the Coordinate System tab and set the coordinate system to the appropriate new system.
button in the Properties window, the coordinate system for the original map layer is used after updating the file. If this is not the correct coordinate system, click on the map layer to select it. In the Properties window, click on the Coordinate System tab and set the coordinate system to the appropriate new system.
Save File
The  button displays the Save Grid As dialog. Type a File name and change the Save as type to the desired grid file format. Click Save. If a coordinate system has been defined on the Coordinate System tab in the Properties window, an Export Options dialog appears. Check the desired file formats. It is recommend that GS Reference (Version 2) file option be checked to generate a .GSR2 file. Click OK and the file is saved.
If the map layer was created using a 3D grid, only 3D grid file formats (HDF, VTK, etc) will be available in the Save as type field.
Grid Type
The Grid type field tells the user whether a 2D grid or 3D grid was used to create the map layer. This field is informational only.
Slice Z Value
The Slice Z value defines which horizontal slice of a 3D grid file is mapped. Click on the current value and enter a specific number to view the results for a that horizontal slice. Click and drag the slider to see the mapped results change as the slice value changes.
By default, Surfer will select a Z value near the middle of the range as the Slice Z value.
Save Slice
The Save Slice command saves the current horizontal slice of a 3D grid as a 3D grid file.
Click the button to display the Save Grid As dialog. Type a File name and change the Save as type to the desired grid file format. Click Save. If a coordinate system has been defined on the Coordinate System tab in the Properties window, an Export Options dialog appears. Check the desired file formats. It is recommend that GS Reference (Version 2) file option be checked to generate a .GSR2 file. Click OK and the file is saved.
Smoothing
The Smoothing option allows you to smooth the contours displayed on the map. Click on the existing value (None, by default) and select a new smoothing value from the list. If smoothing is enabled, contour lines may cross. The Smoothing option in the contour map properties applies a constrained spline smoothing algorithm to interpolate additional contour vertices. Each line is separately calculated, thus the lines can cross if too much smoothing is applied.
A better method to smooth contours is to regrid the data using the Grids | New Grid | Grid Data command, use the Grids | Edit | Spline Smooth or Grids | Resize | Mosaic commands to create a new grid with smaller grid node spacing. See Smoothing Contours for more information on smoothing.
Fault Line
If your grid file contains faulting information, you can set the fault line color, style, opacity, and thickness of the fault line drawn on the contour map by clicking on the ![]() next to Fault line and changing the appropriate line property options.
next to Fault line and changing the appropriate line property options.
NoData Regions
The NoData Regions section allows you to choose fill and line color properties for areas containing nodes assigned the NoData value.
Click on the ![]() next to Fill Properties to set fill properties for NoData areas, or to load a custom fill pattern. If no colors appear after setting these options, click on the Levels tab and check the box next to the Fill contours option.
next to Fill Properties to set fill properties for NoData areas, or to load a custom fill pattern. If no colors appear after setting these options, click on the Levels tab and check the box next to the Fill contours option.
Click on the ![]() next to Line Properties to set the line properties that outline the NoData area.
next to Line Properties to set the line properties that outline the NoData area.