View Properties
Maps can be displayed at any orientation using the map properties, View tab. The projection, rotation, tilt, and field of view of a map are changed on this page.
View Page
The View page is located in the Properties window. To open the map properties, click on the Map object in the Contents window.
|
|
|
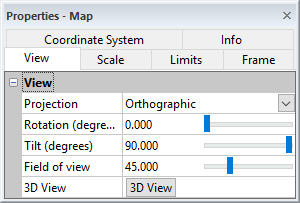
Control the orientation of the map or maps on the View page. |
Multiple Maps
When you have more than one map on the page, the View settings are applied to all selected maps. For example, this command is useful if you have a contour map and 3D wireframe based on the same grid file and displayed in the same plot window. You can select the map object for both the contour map and 3D wireframe. In the Properties window, click on the View tab to change the settings for both maps at one time.
Projection
The Projection group sets the type of projection for the selected maps. Perspective projections more closely simulate reality, but Orthographic projections maintain parallel lines and allow accurate measurements to be taken from the drawing.
Perspective Projection
The Perspective projection creates a visual effect whereby the size of the surface varies with the distance from the observer. When a Perspective projection is used, you can change the Field of View value to increase or decrease the perspective effect.
Orthographic Projection
The Orthographic projection creates a plot with a projection of the surface onto a plane, oriented perpendicular to the line of sight between the observer and the surface.
Rotation
The Rotation (degrees) value controls the rotation of the map about the center. As the Rotation (degrees) value increases, the map rotates in a counterclockwise direction.
To change the Rotation (degrees), click in the box next to Rotation (degrees). Highlight the existing value and type a new value. Values are always displayed with three digits after the decimal. Press ENTER on the keyboard after typing a new value to show the value on the map. Alternatively, click and drag the  to a new value. Values must range between zero and 360.000.
Tilt
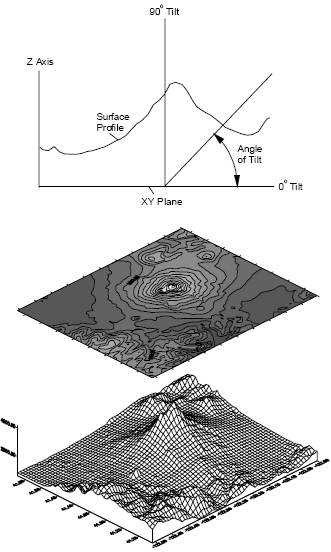
Tilt refers to the orientation of the Z axis in the map display. A zero degree tilt means the Z axis lies in the plane of the page or screen. As the angle of tilt increases, the Z axis tilts toward the viewer. A 90.000 degree tilt means the XY plane lies in the plane of the page or screen and is orthogonal to the viewing direction. The default tilt is 30.000 degrees for 3D wireframes and 3D surfaces, and 90.000 degrees for all other map types. When you tilt three dimensional maps (i.e. 3D surface) to 90.000 degrees, the surface relief is no longer visible.
To change the Tilt (degrees), click in the box next to Tilt (degrees). Highlight the existing value and type a new value. Values are always displayed with three digits after the decimal. Press ENTER on the keyboard after typing a new value to show the value on the map. Alternatively, click and drag the to a new value. Values must range between zero and 90.000.
|
|
|
Maps can be displayed at any rotation angle and at any tilt angle from zero to 90 degrees. When more than one map is selected, the view parameters are applied to all selected maps. |
Field of View
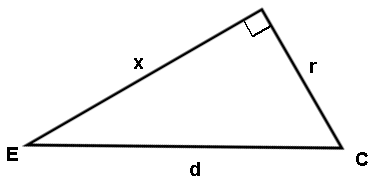
The Field of View controls the perspective effect of the Perspective projection option. The perspective effect is the visual effect of the map changing size relative to the distance from the observer. A small Field of View shows the map in perspective as the if the observer was far from the viewpoint, making the perspective more pronounced. A large Field of View shows the map in perspective as if the observer was very close to the viewpoint. The Field of View angle is formed by the left edge of the bounding box, the viewpoint, and the right edge of the bounding box. The image below illustrates the bounding sphere wedged into the viewing cross section.
|
|
|
The field of view cross section shows the position of the eye (E), the center of the surface (C), the distance from the eye to the point (d), and the radius of the bounding sphere around the surface plot (r). |
With an Orthographic projection the Field of View values have no effect. Note that the Field of View parameter does not influence the map scale.
To change the Field of view, click in the box next to Field of view. Highlight the existing value and type a new value. Values are always displayed with three digits after the decimal. Press ENTER on the keyboard after typing a new value to show the value on the map. Alternatively, click and drag the to a new value. Values must range between one and 160.000.
3D View
Click 3D View to view the map in a new 3D view window. You can also create a new 3D view by selecting the map and clicking Map Tools | View | 3D View. The map must include at least one grid-based layer with 3D data to create a 3D view, e.g. a grid-based, point cloud, drillhole, base, or post layer.
Example of Tilt, Rotation, and Projection Parameters
|
|
|
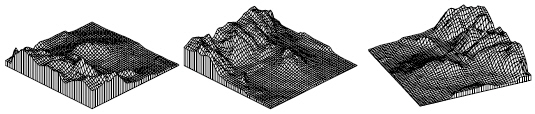
This is the same wireframe displayed at the same rotation angle but different tilt angles: 10, 30, and 45 degrees. |
|
|
|
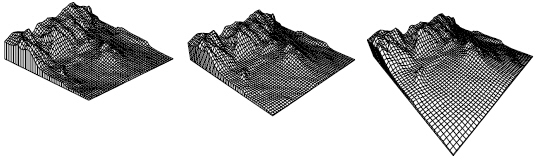
This is the same wireframe displayed at the same tilt angle but different rotation angles. |
|
|
|
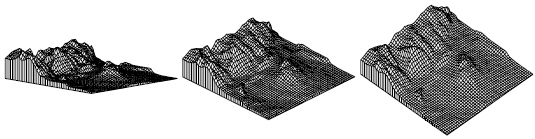
This is the same wireframe using different projection parameters. The map on the left uses an Orthographic projection. The map in the middle uses a Perspective projection with a Field of View value of 20 degrees. The map on the right uses a Perspective projection with a Field of View value of 75 degrees. |