Using Color Spectrums in Map Series
Sometimes it is necessary to use the same range of colors on different maps. By default, color spectrums are assigned to the minimum and maximum data values for a given data set. If the maps have different data ranges, the colors will not map to the same data values and it will be difficult to compare the maps. In this case, you may want to override the default data limits and assign custom values in the Colormap EditorData group.
Example
The following example contains steps on how to create maps in a series that contain the same color spectrums although the data minimums and maximums differ. The example color relief maps show the same gridded area at three different points in time. To accurately compare the maps, the color spectrum needs to be the same through time even when the range of values fluctuates between grids.
Know Your Data
The first step in producing maps with the same color series is to know your data. Find the minimum and maximum data values for all of your data sets before you begin. This will help you to decide the minimum and maximum values to use in the color spectrum for the series of maps. In this example, the maximum Z value is +251 in one of the grids, and the minimum Z value is -261 in another grid. The largest and smallest Z values do not appear in the same grid.
|
|
|
The three maps shown above all use the same color spectrum range, even though the grid minimums and maximums differ. |
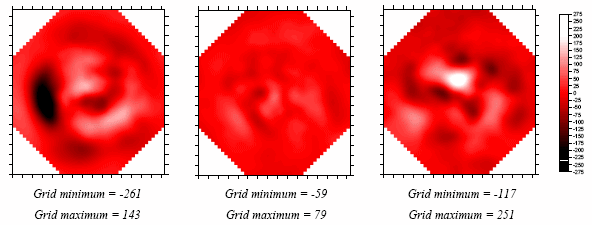
The three maps above show the same phenomena over a period of time. The grid ranges are not the same, but since the maps are to be compared, the colors need to map to the same data values for all maps. Using the same color spectrum .CLR file and changing the minimum and maximum spectrum data values allows you to quickly compare the maps visually. The color scale bar to the right is used for all three maps. The map on the left contains a dark black area because it has some extreme negative values, but it does not have any pure white because it does not have extreme positive values. The map on the right is opposite, it contains extreme positive values so there is an area of pure white, but the negative values are not extreme so there is no pure black. The map in the center does not contain extremes in either direction so it is mostly red. Note that these maps have "stair step" edges due to NoData regions in the corners. A smaller grid spacing or interpolating the pixels would smooth the edges.
Creating a Color Spectrum File
After you know the series minimum and maximum and have decided on a spectrum minimum and maximum, you can create a color spectrum .CLR file to use with all the data. In this example, -275 is the minimum and +275 is the maximum.
To create a color spectrum .CLR file:
-
Create a map using the Home | New Map | Color Relief command. A color relief map is used throughout this example, though you can use contour maps or any other map type that uses a colormap in this procedure.
-
Select one of the sample .GRD files and click Open.
-
Click once on the color relief layer to select it.
-
In the Properties window, click on the General tab.
-
In the General section, click the
 button next to the currently selected colormap displayed in the Colors option to open the Colormap Editor.
 -
In the Data section, change the Minimum to -275 and the Maximum to +275.
-
In the color spectrum bar, left-click in the middle of the color spectrum to add an anchor node. While the node is still selected, change the Value to -200 or slide the node to the -200 position (watch the numbers in the Value box). The minimum color (at -275) is black. Select black for the -200 node as well.
-
Repeat step 6 to add nodes at zero (gray) and +200 (white).
-
Click the Save button to save the color spectrum .CLR file.
-
In the Save As dialog, type a File name and click Save.
-
Click OK to make the color change to existing map.
Using the Color Spectrum File in Other Maps
After you have created the color spectrum file as above, you can use it in the remainder of the maps in a series. To use a color spectrum file in another map:
-
Create the map by clicking the Home | New Map | Color Relief command.
-
In this example, a new color relief map is created with the next grid file. Select the next grid file and click Open.
-
Click once the color relief layer to select it.
-
In the Properties window, click on the General tab.
-
In the General section, click the
button next to the currently selected colormap displayed in the Colors option. -
Click the Load button in the Colormap Editor and open the color spectrum .CLR file you just created.
-
In the Data group, set the Minimum and Maximum to the pre-determined values. In this example, the minimum is set to -275 and the maximum to +275.
-
Click OKto make the color change to this map.
-
Repeat this process for the rest of the maps in the series.