Data Metrics Z Order Statistics
There are five groups of data metrics: Z Order Statistics, Z Moment Statistics, Other Z Statistics, Data Location Statistics, and Terrain Statistics.
The data at a grid node within the search parameters are sorted for the Z order statistics.
|
|
where ![]() . Square brackets indicate ordered Z values.
. Square brackets indicate ordered Z values.
|
Data Metric |
Definition |
Equation |
|
Minimum |
each nodal value is the minimum Z value of data selected by the specified sector search centered at that node |
|
|
Lower Quartile |
each nodal value is the 25th percentile Z value of data selected by the specified sector search centered at that node |
|
|
Median |
each nodal value is the median Z value of data selected by the specified sector search centered at that node |
|
|
Upper Quartile |
each nodal value is the 75th percentile Z value of data selected by the specified sector search centered at that node |
|
|
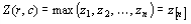
Maximum |
each nodal value is the maximum Z value of data selected by the specified sector search centered at that node |
|
|
Range |
each nodal value is the difference between the maximum Z value and the minimum Z value for the data selected by the specified sector search centered at that node |
|
|
Midrange |
each nodal value is the average of the maximum Z value and the minimum Z value, for the data selected by the specified sector search centered at that node |
|
|
Interquartile Range |
The Interquartile Range data metric generates a grid for which each nodal value is the difference between the 75th percentile Z value and the 25th percentile Z value, for the data selected by the specified sector search centered at that node. This data metric shows the spatial variation of variability of the data, but it focuses on the middle fifty percent of the data only. Thus, it is insensitive to variations in the tails of the local distributions |
|