Cokriging
Cokriging is a geostatistical gridding method that uses a densely sampled second correlated variable to improve the estimation of a primary variable. For cokriging to be effective, the two variables must be correlated and the primary variable must be undersampled with respect to the secondary variable. See Kriging for more information about the interpolation method.
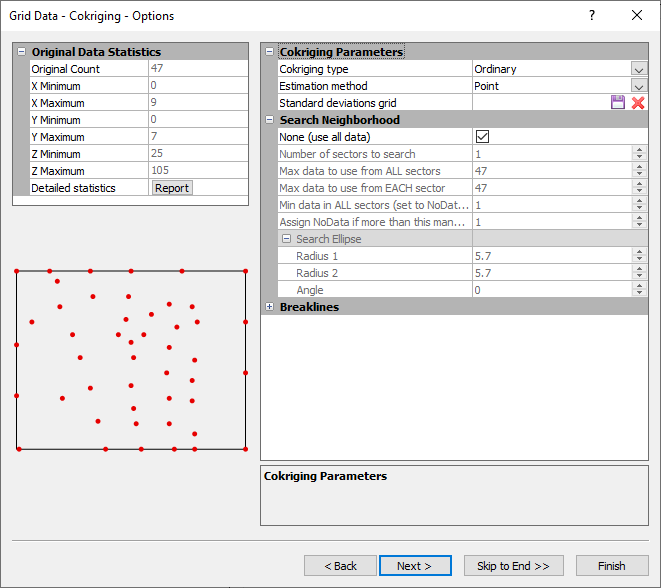
Cokriging Options Dialog
In the Grid Data dialog, specify Cokriging as the Gridding Method and click the Next button twice to open the Grid Data Cokriging Options dialog.
|
|
|
Specify the cokriging standard deviations file, cokriging type, and estimation method in the Grid Data Cokriging Options dialog. |
Cokriging Type
Select the desired variation of the cokriging algorithm from the Cokriging type list.
- Simple cokriging imposes no constraints on the sum of the weights of the variables. This version requires working on data residuals or equivalently on variables whose means have all been standardized to zero.
- Ordinary cokriging sets the sum of the weights applied to all variables to one. The Ordinary type is the default selection.
- Traditional Ordinary cokriging sets the sum of the weights applied to the primary variable to one and the sum of the weights applied to the secondary variable to zero. This formulation tends to limit severely the influence of the secondary variable.
Estimation Method
Choose Point or Block Kriging from the Estimation method list.
Surfer includes two Estimation methods: Point Kriging and Block Kriging. A detailed discussion of the two methods can be found in ![]() Isaaks and Srivastava (1989, Chapters 12 and 13)1. Ordinary (no drift) and Universal Kriging (linear or quadratic drift) algorithms can be applied to both Kriging types.
Isaaks and Srivastava (1989, Chapters 12 and 13)1. Ordinary (no drift) and Universal Kriging (linear or quadratic drift) algorithms can be applied to both Kriging types.
Both Point Kriging and Block Kriging generate an interpolated grid. Point Kriging estimates the values of the points at the grid nodes. Block Kriging estimates the average value of the rectangular blocks centered on the grid nodes. The blocks are the size and shape of a grid cell. Since Block Kriging is estimating the average value of a block, it generates smoother contours (block averaging smooths). Furthermore, since Block Kriging is not estimating the value at a point, Block Kriging is not a perfect interpolator. That is even if an observation falls exactly on a grid node, the Block Kriging estimate for that node does not exactly reproduce the observed value.
When a Kriging standard deviation grid is generated with Block Kriging, the generated grid contains the Block Kriging standard deviations and not the Point Kriging standard deviations.
The numerical integration required for point-to-block variogram calculations necessary for Block Kriging are carried out using a 3x3, two-dimensional Gaussian-Quadrature. In particular, Surfer uses Section 25.4.62 of Aramowitz and Stegun (1972).2I
Point Kriging is the default method.
|
|
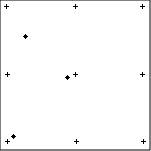
In the diagram above, the crosses indicate a block of grid nodes and the filled circles indicate data points. If we were to interpolate the center grid node with Point Kriging, the data point closest to the center grid node would have the greatest weight in determining the value of the grid node. If we were to interpolate the center grid node with Block Kriging, all three data points within the block of grid nodes are averaged to interpolate the grid node value.
Output Grid of Kriging Standard Deviations
Click the  button to enter a file name into the Standard deviations grid field to produce an estimation standard deviation grid. If this box is empty, then the estimation standard deviation grid is not created. Click the
  button to remove the destination path from the Standard deviations grid field.
The Kriging standard deviation grid output option greatly slows the Kriging process. This is contrary to what you may expect since the Kriging variances are usually a by-product of the Kriging calculations. However, Surfer uses a highly optimized algorithm for calculating the node values. When the variances are requested, a more traditional method must be used, which takes much longer.
There are several cases where a standard deviation grid is incorrect or meaningless. If the variogram model is not truly representative of the data, the standard deviation grid is not helpful to your data analysis. Also, the Kriging standard deviation grid generated when using a variogram model estimated with the Standardized Variogram estimator or the Autocorrelation estimator is not correct. These two variogram estimators generate dimensionless variograms, so the Kriging standard deviation grids are incorrectly scaled. Similarly, while the default linear variogram model will generate useful contour plots of the data, the associated Kriging standard deviation grid is incorrectly scaled and should not be used. The default linear model slope is one, and since the Kriging standard deviation grid is a function of slope, the resulting grid is meaningless.
The Kriging standard deviation grid cannot be created when the None (use all data) option in the Search section is selected.
Search Neighborhood
The options in the Search Neighborhood section specify search rules. Search options control which data points are considered by the gridding operation when interpolating grid nodes. The same search parameters are used for both the primary and secondary variables.
Breaklines
The Breaklines section is used to add breaklines to the gridding process. Faults are not supported with Kriging.
See Also
Using Variogram Results in Kriging