Residuals
The Grids | Calculate | Residuals command computes the vertical difference between the Z value in the data file and the interpolated Z value on a gridded surface. It gives a quantitative measure of how well the grid file agrees with the original data.
A residual is the difference between the Z value of a point in a data file and the interpolated Z value at the same XY location on a gridded surface. Residual values are reported as either positive or negative values. If the Z value in the data file is greater than the Z value derived from the gridded surface, the residual value is positive. A negative residual value indicates that the Z value from the data file is less than the interpolated Z value at that point. If the grid file is contains the NoData value at the data point, the residual value is left blank in the worksheet. Surfer uses a bilinear interpolation method to calculate Z values at points that do not coincide with grid nodes.
The formula used to compute a residual value is:
|
|
where:
![]() = the residual value
= the residual value
![]() = the Z value in the data file
= the Z value in the data file
![]() = the Z value of the surface at the XY coordinate from the grid file
= the Z value of the surface at the XY coordinate from the grid file
A worksheet window is automatically opened after the Residuals command is used. The worksheet includes the data file used for the calculation and the newly generated residual information. Use the worksheet's Data | Data | Statistics command to obtain statistical information on the calculated residuals.
|
|
|
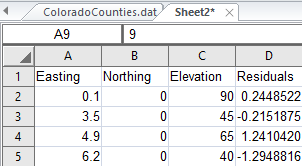
After clicking OK in the Grid Residuals dialog, the worksheet window opens with the original data and the new residuals column. |
The Grid Residuals Dialog
Click the Grids | Calcluate | Residuals command or the  button to open the Grid Residuals dialog.
|
|
|
Specify the locations for the X, Y, and Z data and the location for the calculated residuals in the Grid Residuals dialog. |
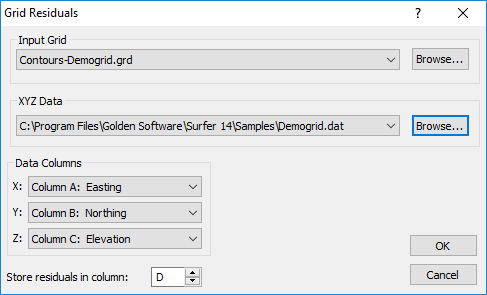
Input Grid
Specify the source map layer or grid file in the Input Grid section. Click the current selection and select a map layer from the list. Only map layers created from grid files are included in the Input Grid list. Click Browse to load a grid file with the Open Grid dialog.
XYZ Data
Specify the data file in the XYZ Data section. Click the current selection and select a map layer from the list. Only post and classed post layers are displayed in the XYZ Data list. Click Browse to load the data file with the Open Data dialog.
Data Columns
Specify the location for the X, Y, and Z coordinates from the data file in the Data Columns section.
Store Residuals in Column
In the Store residuals in column box, enter the column where you would like the residuals stored. By default, Surfer selects the first empty column in the data file.
To Calculate Residuals
- Click the Grids | Calculate | Residuals command or the button.
- In the Open Grid dialog, select the grid file to be used for the residual calculation and then click Open.
- In the Open dialog, select the data file to be compared to the grid file, and then click Open.
- In the Grid Residuals dialog, specify the location for the X, Y, and Z coordinates in the Data Columns section.
- In the Store residuals in column box, enter the column where you would like the residuals stored. By default, Surfer selects the first empty column in the data file.
- Click OK and the worksheet window opens. The worksheet window displays the data file as it was specified in the Grid Residuals dialog with the additional column for the residual data.
See Also
Calculating the Agreement between a Grid and the Original Data File