Grid Slice
The Grids | Calculate | Slice command or the  button produces cross sectional data for 2D and 3D objects. The cross section is generated by taking a vertical slice through a gridded surface along a boundary line. Surface traces on a cross section are sometimes referred to as profile lines.
Another method to create a slice from the data is to use the Map Tools | Add to Map | Profile command. The profile automatically creates a graph showing accumulated distance and elevation. The Grids | Calculate | Slice command produces a data file that can show the same object, but contains additional data as well.
The surface is based on a grid file and the boundary line is based on the information in a vector file or base map. The boundary line can be defined by a polyline in a base map or by one of the following file formats:
|
|
|
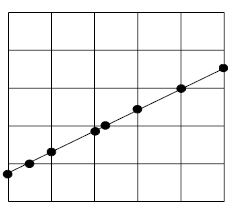
At each point where the boundary line crosses a grid line, a cross section data point is generated. |
The Grid Slice Dialog
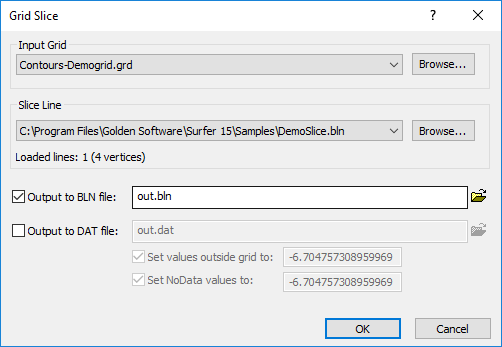
Click the Grids | Calculate | Slice command or the button. The Grid Slice dialog opens.
|
|
|
The Grid Slice dialog allows you to specify the resulting .BLN and/or .DAT file name and location. |
Input Grid
Specify the source map layer or grid file in the Input Grid section. Click the current selection and select a map layer from the list. Only map layers created from grid files are included in the Input Grid list. Click Browse to load a grid file with the Open Grid dialog.
Slice Line
Specify the file or base layer with the slice line in the Slice Line section. Load either a map layer or vector file in the Slice Line section:
- Click the current selection and select a base layer from the list. Only base layers that contain at least one polyline or polygon will be included in the list. The base layer must use the same source coordinate system as the grid.
- Click Browse to load a vector file with the Open dialog. The file must use the same coordinate system as the grid.
Once a file or map layer has been selected the number of lines and vertices is displayed below the slice line selection.
Output BLN File
A Blanking BLN file may be produced with the slicing operation by selecting the Output to BLN file option. Type a path and filename for the Output BLN, or set the path and filename in the Save As dialog by clicking the ![]() button next to Output BLN. The blanking file contains three columns of data:
button next to Output BLN. The blanking file contains three columns of data:
The output BLN file can be used to display a profile in Surfer as a base map. The Profile command generates a profile with more display options. However, it may be faster to generate a profile from the Output BLN when the surface trace already exists in a vector file format and has many vertices. To create a profile from the Output BLN file,
- After creating the BLN file with the Slice command, click the Home | New Map | Base command
- Select the output BLN file in the Import dialog.
- Click Open and the profile is created as a base map. The X axis corresponds to accumulated distance along the trace, and the Y axis corresponds to grid Z values along the trace.
- Select the Map object for the output BLN base map.
- On the Properties window Scale page, clear the Proportional XY scaling check box.
- On the Properties window Scale page, adjust the X Scale and Y Scale section Length (page units) property values until the profile scaling is displayed as desired.
Output DAT File
Cross section data can be written to an ASCII data .DAT file during the Slice operation by selecting the Output to .DAT file option. Type a path and filename for the Output DAT, or set the path and filename in the Save As dialog by clicking the ![]() button next to Output DAT. The ASCII data file consists of five columns of data. When the profile is written to the ASCII file, a new row of data is generated for each point where the boundary line intersects the grid lines in the data file. The output data file can be used to plot the profile in a graphing application, such as Grapher. The columns in the data file are arranged as follows:
button next to Output DAT. The ASCII data file consists of five columns of data. When the profile is written to the ASCII file, a new row of data is generated for each point where the boundary line intersects the grid lines in the data file. The output data file can be used to plot the profile in a graphing application, such as Grapher. The columns in the data file are arranged as follows:
Set Values Outside Grid To
The Set values outside grid to option assigns a special Z value to points that lie beyond the grid limits when the check box is active. If this option is not activated, points outside the grid limit are not included in the output data file. The default value is equal to the following equation:
|
|
Set NoData Values To
The Set NoData values to option assigns a special Z value to points that lie inside NoData regions when the check box is selected. If the check box is cleared, points inside the NoData areas are not included in the output data file.
OK or Cancel
Click OK and a data file (and a blanking file, if specified) is created. Click Cancel to exit the dialog without creating the data.
To Create a Data File Containing Cross Section Data
- Click the Grids | Calculate | Slice command.
- In the Open Grid dialog, select a grid file and click Open.
- In the Open dialog, select the blanking file to use when producing the profile data and then click Open.
- If desired, enter a name for the Output BLN in the Grid Slice dialog by clicking the
 button to open the Save As dialog.
 - Specify the name for the Output DAT by clicking the button to open the Save As dialog.
- Click OK and a data file (and a blanking file, if specified) is created.
|
|
|
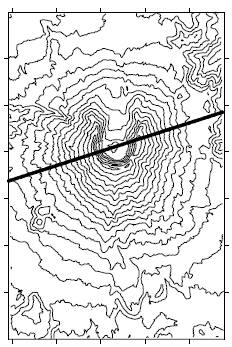
You can display the profile line across the contour map. This is the profile line used to produce the following cross section. |
|
|
|
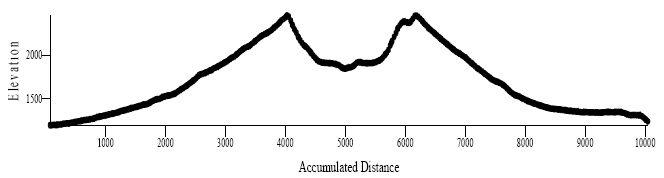
This is the cross section taken from the profile line on the map. The cross section was created as a base map using the Output BLN. |