Point Cloud Layer General Properties
The General page of the Properties window contains the properties for defining the source data and modifying the point cloud layer appearance.
|
|
|
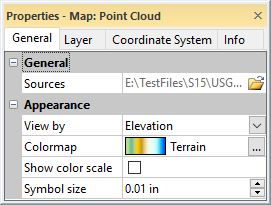
Set the point cloud layer appearance properties in the General page. |
Sources
The Sources property lists the source LiDAR data files. Click  to open the Import Points dialog to add or remove source files or change the point filters for the source data.
Appearance
The Appearance section includes properties for modifying the point cloud layer appearance in the plot window and 3D view.
View By
The View by property specifies whether the Colormap is applied to the points by Elevation, Intensity, Return number, or Classification.
- Elevation applies point color by elevation value. The default colormap is Terrain.
- Intensity applies point color by intensity value. The default colormap is GrayScale.
- Return number applies point color by return number. The default colormap is GrayScale.
- Classification applies point color by classification value. A custom colormap is used by default. See the LAS LiDAR Binary File Description for a list of classes and colors.
Click the current selection and select the desired option from the list to change the View by property.
Colormap
The Colormap property specifies the colormap for the four View by options. Each View by option, Elevation, Intensity, Return number, and Classification uses a separate colormap. The previous Colormap settings are maintained when switching to a new View by option. To change the colormap for the current View by selection, click the current colormap and select a predefined colormap from the list. To modify the colormap, create a custom colormap, or change the data to color mapping, click  in the Colormap field to open the Colormap Editor.
Show Color Scale
The Show color scale option displays a color scale bar adjacent to the map. The color scale bar indicates the colors assigned to the levels on the map, and the associated values are displayed as labels on the color scale bar. When the Show color scale box is checked, the color scale bar is displayed. If the colormap is set to a logarithmic scale, the color scale bar will automatically display logarithmic scaling.
The Show color scale option is not available when View by is set to Classification. When Show color scale is selected and the View by property is changed to Classification , the color scale is removed. Change the View by property to Elevation , Intensity , or Return number to enable the Show color scale property.
Symbol Size
The Symbol size property specifies the diameter of the points in the layer in page units. Type a value between 0 and 0.25 in (0 and 0.635 cm) in the Symbol size field to change the size of the point cloud points. Alternatively, click the  to increase or decrease the point Symbol size . When the Symbol size is set to 0, the point symbols will be one pixel in size.