Proportional Scaling
The Symbol Size group on the Symbol page of the post map properties allows you to specify the symbol Sizing method in two ways: fixed or proportional. Fixed size uses the same size symbols throughout the map. Set the Sizing method to Fixed size and set the Symbol size in page units. Change the Sizing method to Proportional to use symbols that are scaled relative to a data column.
Proportional Scaling Dialog
To open the Proportional Scaling dialog, click on the post map to select it. In the Properties window, click on the Symbol tab. Change the Sizing method to Proportional to use proportional scaling. Click the Scaling button next to Proportional to open the Proportional Scaling dialog. The Proportional option sizes all symbols proportionally, based on scaling information in the Proportional Scaling dialog. By default, the scaling is based on the data in the third worksheet column. This column usually contains the Z values. If you want to scale your symbols based on data in a different column, click the Scaling button to display the Proportional Scaling dialog. Select the desired column in the Worksheet Column Containing Height list.
|
|
|
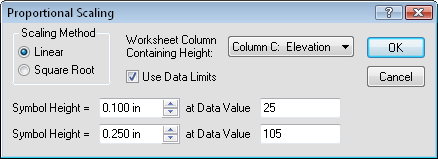
The Proportional Scaling dialog is opened by clicking on the Scaling button in the Symbol Size section of the Symbol page in the Properties window. |
Symbol Height
For proportional scaling, Surfer uses two Symbol Height to Data Value pairs to define the scaling equations. These pairs define the symbol size at two different data values, usually the minimum and maximum values in the height column. All other values are scaled proportionally. Assume the first symbol height is defined as H1 and is associated with the minimum Z value in the data file (Z1). Similarly, the maximum symbol height is defined as H2 and is associated with the maximum Z value in the data file (Z2). Then Hnis the symbol height for a symbol with the proportional value
Linear Scaling Method
If the Scaling Method is set to Linear, a standard linear interpolation is used:
|
|
Square Root Scaling Method
If the Scaling Method is set to Square Root, a standard square root interpolation equation is used:
|
|
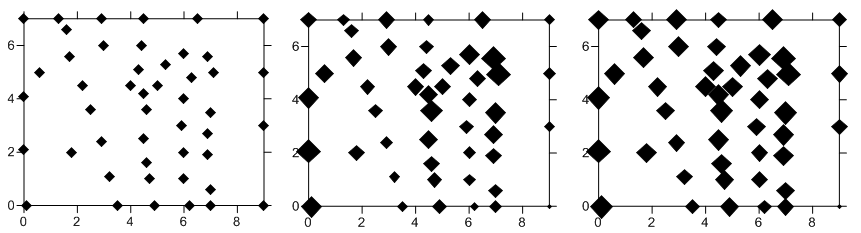
Square root scaling is commonly used with solid symbols to offset the fact that the area increases as a function of the symbol height squared. Square root scaling is essentially making the area of the symbol proportional to the Z value, rather than making the size of the symbol proportional to the Z value.
|
|
|
This graph shows the height versus Z value relationship for linear proportional symbols and square root proportional symbols. |

Enter the values you wish to use for H1, H2, Z1, and Z2 into the Symbol Height and Data Value fields, respectively.
Use Data Limits
Check the Use Data Limits option to use the minimum and maximum data values in the specified height column for Z1, and Z2.