Post Map
Post maps indicate X, Y locations with symbols and labels. Post maps display a fixed or proportionally sized symbol at each data location. Posting data points on a map can be useful for determining the spatial distribution and density of your data, as well as placing data or text information at specific locations on the map. You can specify the symbol type, size, color, and angle for the data points. Associated data values or text strings may be placed next to the posted point. The size, angle, color, and typeface for the label can also be specified. Multiple columns can be displayed as labels around each symbol.
|
|
|
This post map shows varied symbols and labels. A contour map is overlaid. |
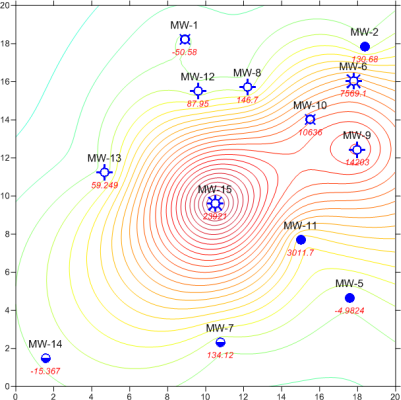
Post maps can be used to show the spatial distribution of the original data when overlaid on a grid-based map, such as a contour map. This is often an excellent means of presenting a qualitative measure for the accuracy of the contour lines on the map.
The limits of a post map are based on the limits of the X and Y coordinates contained within the associated data file. These limits can be changed if necessary.
Data Files
Post maps are created from data files containing X and Y coordinates. These coordinates are used to determine the locations for symbols on the post map. The data files can contain additional information to size the symbols, determine the symbol angle, set the symbol color, or post text associated with the point location. To create a post map, you must first create a data file in the format described in the Data Files Used for Posting topic.
Creating a Post Map
To create a post map:
- Click the Home | New Map | Post command or the
 button.
 - Select a data file in the Open Data dialog and click Open.
The map is automatically created with reasonable defaults.
If the post map does not have any symbols in it, the map may not have the correct worksheet columns specified or may have text instead of numerical values in the worksheet columns. To determine if this is the case, click on the post map to select it. In the Properties window, click on the General tab. Open the Worksheet Columns section, if necessary. Adjust the X coordinates and Y coordinates columns. If the columns are specified correctly, check the data file to verify that the columns contain numeric data. If the data columns are correct, the post map limits may be incorrect, preventing the data from being displayed. Click on the Map in the Contents window to select it. Check the values on the Limits tab.
Editing an Existing Post Map
To change the features of the post map, open the post map properties by clicking on the post map in the plot window or clicking on the post map name in the Contents window. The properties are displayed in the Properties window.
Adding a Map Layer
When post maps are created, they are independent of other maps in the plot window. For example, creating a post map while a contour map is present in the plot window yields two separate maps, each with its own set of axes and scaling parameters. To create a single map with the post map data points on the contour map, select both maps by clicking the Home | Selection | Select All command. Overlay the maps using the Overlay Maps command.
Alternatively, you can add the post map directly to the existing contour map by creating the post map using the Home | Add to Map | Layer | Post or Map Tools | Add to Map | Layer | Post command. This automatically adds the post map to the contour map axes.
Another alternative, is to create both maps using the Home | New Map commands. Then, select one map and drag the map layer to the other map object. This is equivalent to using the Overlay Maps command to overlay maps. For example, create a contour map with the Home | New Map | Contour command. Create the post map using the Home | New Map | Post command. This creates two separate maps. Click on the post map, hold down the left mouse button, and drag the post map into the contour map. A single map with two map layers, using one set of axes and scaling parameters is created.
You can combine any number of post maps with any other map.
Post Layer Properties
The post layer properties contains the following pages:
Map Properties
The map properties contains the following pages: