Variogram Statistics Properties
Clicking the Display Statistics button on the Statistics page in the Properties window, Statistics button on the Grid Data - Variogram page, or the Statistics button on the New Variogram - Dataset page the shows histograms and scatter plots of the data, as well as providing statistics on the data.
|
|
|
In the Statistics dialog, you can show an X, Y, or Z histogram, view statistics, or generate a variogram report. |
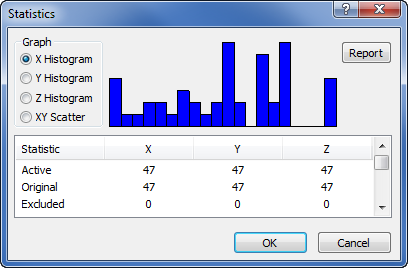
Graph X, Y, Z Histogram or XY Scatter
The X, Y, Z Histogram options show the distribution of the X, Y, and Z data respectively. The histogram is shown to the right of the options. The XY Scatter option shows the distribution of the data as a simple scatter diagram.
Report
Click the Report button to open the statistics and variogram information in a report window. The statistics can be printed if they are opened in the report window.
Statistics
You can use the scroll bar on the right of the statistics box to view the statistics.