What Does a Variogram Represent?
Consider two synthetic data sets; we will call them A and B. Some common descriptive statistics for these two data sets are given in Table 1.1.
|
A |
B |
|
|
Count |
15251 |
15251 |
|
Average |
100.00 |
100.00 |
|
Standard Deviation |
20.00 |
20.00 |
|
Median |
100.35 |
100.92 |
|
10 Percentile |
73.89 |
73.95 |
|
90 Percentile |
125.61 |
124.72 |
Table 1.1 Some common descriptive statistics for the two example data sets.
The histograms for these two data sets are given in Figures 1.1 and 1.2. According to this evidence the two data sets are almost identical.
|
|
|
|
Figure 1.1 Data Set A Histogram |
Figure 1.2 Data Set B Histogram |


However, these two data sets are significantly different in ways that are not captured by the common descriptive statistics and histograms. As can be seen by comparing the associated contour plots (see Figures 1.3 and 1.4), data set A is rougher than data set B. Note that we can not say that data set A is "more variable" than data set B, since the standard deviations for the two data sets are the same, as are the magnitudes of highs and lows. The visually apparent difference between these two data sets is one of texture and not variability.
|
|
|
|
Figure 1.3 Data Set A Contour Plot |
Figure 1.4 Data Set B Contour Plot |


In particular, data set A changes more rapidly in space than does data set B. The continuous high zones (red patches) and continuous low zones (blue patches) are, on the average, smaller for data set A than for data set B. Such differences can have a significant impact on sample design, site characterization, and spatial prediction in general.
It is not surprising that the common descriptive statistics and the histograms fail to identify, let alone quantify, the textural difference between these two example data sets. Common descriptive statistics and histograms do not incorporate the spatial locations of data into their defining computations.
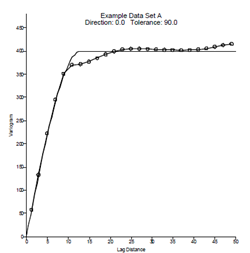
The variogram is a quantitative descriptive statistic that can be graphically represented in a manner which characterizes the spatial continuity (i.e. roughness) of a data set. The variograms for these two data sets are shown in Figures 1.5 and 1.6. The difference in the initial slope of the curves is apparent.
|
|
|
|
Figure 1.5 Data Set A Variogram and Model |
Figure 1.6 Data Set B Variogram and Model |

Back to Variogram Introduction
Next to What is a Variogram?