New Variogram Dataset Properties
The New Variogram dialog is used to create a new variogram. Click Grids | New Grid | Variogram | New Variogram and select a data file to open the New Variogram dialog.
Dataset Page
The Dataset page defines the input data in the data file.
|
|
|
The Data page in the New Variogram dialog is used to set the data columns, filter duplicate data, and to view data statistics. |
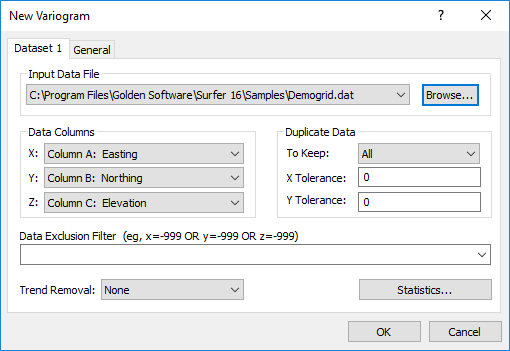
Input Data File
The Input Data File is the data file from which the variogram is created. Click Browse to select a new data file in the Open Data dialog.
Data Columns
You can specify the columns for the X data, the Y data, and the Z data in the Data Columns group. Surfer defaults to X: column A, Y: column B, and Z: column C. Your data can be in any three columns, however. Click the down arrow on each box and select the appropriate column for each variable.
Duplicate Data
You can choose the type of duplicate data to use in the variogram gridding process from the To Keep list. The X Tolerance and Y Tolerance boxes set the distance, in data units, that define whether or not the data are duplicates. If the data do not share identical coordinates, but you would like close-by points to be considered duplicates, use this setting.
Data Exclusion Filter
To set up rules for excluding data when gridding, use the Data Exclusion Filter. The Data Exclusion Filter can exclude data based on X, Y, or Z values or by a number in another column in the worksheet.
To use a stored function, click the ![]() next to the current function. This will display the ten most recent functions used. The functions are stored in the registry, so the equations are stored between Surfer sessions. You can also start typing the function in the function box. If the function is in the ten function history, the entire function will auto-complete.
next to the current function. This will display the ten most recent functions used. The functions are stored in the registry, so the equations are stored between Surfer sessions. You can also start typing the function in the function box. If the function is in the ten function history, the entire function will auto-complete.
Trend Removal
The Trend Removal list contains three options for detrending the data before creating a variogram. The Trend Removal options carry out a simple polynomial least squares regression of the data and compute the variogram grid for the resulting residuals only. See Section 6.12 in Kitanidis (1997) for a more detailed discussion of detrending data.
-
None should be used most of the time.
-
Linear trend removal should be used when the Kriging algorithm is applied with a linear drift.
-
Quadratic trend removal should be used when the Kriging algorithm is applied with a quadratic drift.
Creating a variogram with Linear or Quadratic trend removal does not automatically change the Kriging options in the Grid Data dialog. You must manually change the Drift Type on the Options page of the Grid Data dialog so that it matches the trend removal of the variogram.
Statistics
Click Statistics to display statistics about the data in the Statistics window.