Variogram Overview
Surfer includes an extensive variogram modeling subsystem. This capability was added to Surfer as an integrated data analysis tool. The primary purpose of the variogram modeling subsystem is to assist you in selecting an appropriate variogram model when gridding with the kriging algorithm. Variogram modeling may also be used to quantitatively assess the spatial continuity of data even when the kriging algorithm is not applied.
Surfer's variogram modeling feature is intended for experienced variogram users who need to learn Surfer's variogram modeling features. The novice variogram user may find the following four authors helpful: Cressie (1991), Isaaks and Srivastava (1989), Kitanidis (1997), and Pannatier (1996). Please refer to Suggested Reading for full references for each of the previous books. If you do not understand variograms or if you are unsure about which model to apply, use Surfer's default linear variogram with the kriging algorithm.
Variogram modeling is not an easy or straightforward task. The development of an appropriate variogram model for a data set requires the understanding and application of advanced statistical concepts and tools: this is the science of variogram modeling. In addition, the development of an appropriate variogram model for a data set requires knowledge of the tricks, traps, pitfalls, and approximations inherent in fitting a theoretical model to real world data: this is the art of variogram modeling. Skill with the science and the art are both necessary for success.
The development of an appropriate variogram model requires numerous correct decisions. These decisions can only be properly addressed with an intimate knowledge of the data at hand, and a competent understanding of the data genesis (i.e. the underlying processes from which the data are drawn). The cardinal rule when modeling variograms is know your data.
Variogram
The variogram is a measure of how quickly things change on the average. The underlying principle is that, on the average, two observations closer together are more similar than two observations farther apart. Because the underlying processes of the data often have preferred orientations, values may change more quickly in one direction than another. As such, the variogram is a function of direction.
The variogram is a three dimensional function. There are two independent variables (the direction q, the separation distance h) and one dependent variable (the variogram value g(q,h)). When the variogram is specified for Kriging we give the sill, range, and nugget, but we also specify the anisotropy information. The variogram grid is the way this information is organized inside the program.
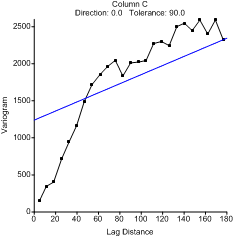
The variogram (XY plot) is a radial slice (like a piece of pie) from the variogram grid, which can be thought of as a "funnel shaped" surface. This is necessary because it is difficult to draw the three-dimensional surface, let alone try to fit a three dimensional function (model) to it. By taking slices, it is possible to draw and work with the directional experimental variogram in a familiar form - an XY plot.
Remember that a particular directional experimental variogram is associated with a direction. The ultimate variogram model must be applicable to all directions. When fitting the model, the user starts with numerous slices, but must ultimately mentally integrate the slices into a final 3D model.
|
|
|
This is a variogram using the default parameters and the sample data file VARIO1.DAT. |
Variogram Properties