Statistics - Worksheet
The Data | Data | Statistics command calculates statistical values for a group of selected numeric cells (see Selecting Cells). Select an entire column or a continuous group of cells in a column to use the Statistics command. If a rectangular block of rows and columns are selected, the Statistics command calculates the statistics for each column separately. A warning message appears if a group of cells cannot be used with the Statistics command. Non-numeric cell entries (empty cells or text) are ignored in statistics calculations.
Statistics Dialog
Use the Data | Data | Statistics command or the  button in the worksheet to open the Statistics dialog.
|
|
|
Click in the box adjacent to the statistics name to compute the statistics for the selected columns. |
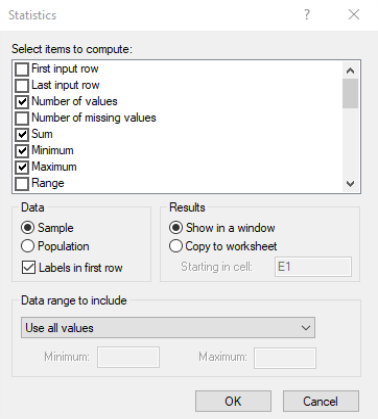
Select Items to Compute
Click in the check boxes next to the statistics options to calculate the statistics for the selected data:
- First input row reports the first row number in the selection. If the Labels in first row option is checked, the First input row is the second row in the selection.
- Last input row reports the last row number containing data in the column.
- Number of values indicates the number of numeric cells in the column.
- Number of missing values indicates the number of non-numeric cells in the selection. If columns are selected by clicking the column letters, the number of missing values includes blank values up to the last used row in the worksheet, which may be different than the last used row in the selected column. If cells are selected by highlighting specific cells, then only the blank cells within the selection are counted.
- Sum is the sum of all numeric cells in the column.
- Minimum indicates the minimum value in the column.
- Maximum indicates the maximum value in the column.
- Range indicates the range of the numeric values in the column (Maximum – Minimum).
- Mean is the arithmetic average of the data values. It is the sum of the data values divided by the number of data values.
- Median is the middle value among the data values. Half of the data values are larger than the median and half are smaller than the median. When there are an even number of data values the median is the average of the two middle values.
- Mode is the value that appears most often in a data set. If the data set contains multiple modes, the modes will be displayed separated by a comma. #N/A will be displayed if no mode exists for the data set, i.e. there is an equal number of each data value.
- First quartile (25thpercentile) is the value such that one-fourth of the data values are smaller than the quartile and three-fourths of the data values are larger than the first quartile.
- Third quartile (75thpercentile) is the value such that three-fourths of the data values are smaller than the quartile and one-fourth of the data values are larger than the third quartile.
- Standard error of the mean
- 95% confidence interval for the mean
- 99% confidence interval for the mean
- Variance
- Average deviation
- Standard deviation
- Coefficient of variation
- Coefficient of skewness
- Coefficient of kurtosis
- Kolmogorov-Smirnov goodness of fit for normal distribution
- Critical value of K-S statistic at 90% significance level
- Critical value of K-S statistic at 95% significance level
- Critical value of K-S statistic at 99% significance level
Data Group
The Data group is used to select Sample or Population statistics. Select Sample or Population statistics, depending on whether the data represent a statistical sample or the complete set of all possible members of a population.
The Labels in first row option is also specified in the Data group. Check the Labels in first row box if the first row of the selection contains descriptive labels. If this box is checked the label appears at the top of the statistics report for each column.
Results Group
The Results group is used to show the statistics report in a window or copy the results to a new location of the worksheet. Select Show in a window to write the statistics results to a Statistics Results dialog. The results in this dialog can be copied to the clipboard to paste to other locations.
Select Copy to worksheet to write the statics report to a new location in the worksheet. Use the Starting in cell box to specify the cell for the upper left corner of the statistics report. If the destination cells contain data, a warning is displayed that data will be overwritten. Click OK to overwrite the data, or click Cancel to set a new Starting in cell location.
Data Range to Include Group
The Data range to include contains options to limit the values where the statistics are calculated. Available options are Use all values, Use values inside the range, Use values outside the range, and Use all values except.
Use all values
When the Data range to include is set to Use all values, all of the values in the highlighted section are used to calculate the statistics.
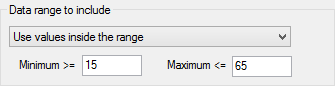
Use values inside the range
When the Data range to include is set to Use values inside the range, the Minimum >= and Maximum <= options are available. Type in the data values that bracket the range of values where the statistics should be calculated. For instance, if the Minimum >= is set to 15 and the Maximum <= is set to 65, only data points between (and including) 15 and 65 are used for calculating the statistics.
|
|
|
Only the values that are inside the range are included in the calculated statistics. |
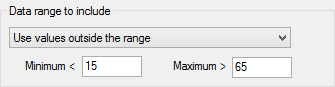
Use values outside the range
When the Data range to include is set to Use values outside the range, the Minimum < and Maximum > options are available. Type in the data values that bracket the range of values where the statistics should be calculated. For instance, if the Minimum < is set to 15 and the Maximum > is set to 65, only data points below 15 or greater than 65 (and excluding 15 and 65) are used for calculating the statistics.
|
|
|
Only the values that are outside the range are included in the calculated statistics. |
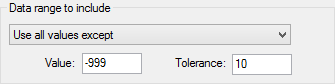
Use all values except
When the Data range to include is set to Use all values except, the Value and Tolerance options are available. Type in the data value that should be excluded in the Value box. The Tolerance value gives a range on either side of the Value. Everything in the range Value-Tolerance to Value+Tolerance is excluded from the statistics calculation. For instance, if the Value is set to -999 and the Tolerance is set to 10, all values between -1009 and -989 are excluded from the statistics. This means that all values less than -1009 and greater than -989 are included in the statistics calculations.
|
|
|
Only the values that are outside the range Value-Tolerance to Value+Tolerance are included in the calculated statistics. |
The Use all values except option can be used to ignore NoData values. For example, the NoData value for the Concentration.grd sample grid file is the Surfer default NoData value, 1.70141E+38. Two methods exist for ignoring the NoData value. One method is to enter the NoData Value displayed in the Grid | Info report exactly into the Value field of the Statistics dialog. Using Concentration.grd as an example, 1.70141E+38 would be entered into the Value field. Another method is to enter an approximation of the NoData value and a tolerance that will include the actual NoData value while excluding the desired data. Using this method with the previous example, 1.70E+38 is entered into the Value field and 1E+37 is entered into the Tolerance field. Both of these methods result in the Statistics command returning results for the non-NoData values only.