Track Cursor
Cursor tracking provides connections between the worksheet, plot windows, and grid node editor windows. Tracking occurs between multiple maps in the plot window. Links are graphical connections that connect what you see on a map to the same location on another map, and to the original data in the worksheet or grid in the grid node editor. This can be useful for finding bad data points, and for showing the same point on multiple maps that have the same X and Y data range.
Track Cursor in the Plot Document
The Map Tools | Layer Tools | Track Cursor command allows you to enable or disable the cursor tracking between multiple maps. Tracking is done on the current map frame's coordinate system. Left-click a map to see the location of the cursor click on additional maps. The cursor tracking is updated with every left-click.
This command can also be used to link map layers to the worksheet or grid. Click a location in the plot window, and the tracking cursor will be displayed in the same location in the plot window and grid editor. The closest point in the worksheet will be highlighted.
3D surface and 3D wireframe maps cannot be used as the source map for cursor tracking. A 3D map can be rotated to a birds eye view (field of view = 45° , rotation = 45° , tilt = 90° ) to see the tracked cursor in the correct location.
Example in the Plot
- Click the Home | New Map | Contour command or the
 button.
 - In the Open Grid dialog, select the Demogrid.grd sample file (located in the Samples folder), and click Open. The contour map is created.
- Click the Home | New Map | Color Relief command.
- In the Open Grid dialog, select the Demogrid.grd sample file (located in the Samples folder), and click Open. The color relief map is created.
- Click on the color relief map and drag it to the right to arrange the maps to be side by side.
- Click the Map Tools | Layer Tools | Track Cursor command or the
 button to enable cursor tracking. A check mark next to Track Cursor indicates cursor tracking is on.
 - With the track cursor command enabled, left-clicking on one map will display the tracking cursor on the other map in the appropriate location.
- To disable cursor tracking, click the Map Tools | Layer Tools | Track Cursor command.
|
|
|
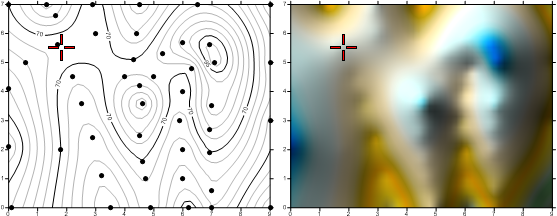
The contour map (left) and color relief map (right) were both created with the sample file, Demogrid.grd. With the track cursor command on, clicking on one map, displays the tracking cursor on the other map in the appropriate location. |
Track Cursor in the Worksheet Document
The Data | Tools | Track Cursor command allows you to enable or disable the cursor tracking between worksheet data, maps in the plot window and grids in the grid node editor. Select cells in the worksheet to position the tracking cursor on the map or grid. Alternatively, in the plot window or grid node editor, click on a location that contains the same XY range as the data file. The closest data point to the click will be highlighted in the worksheet.
Cursor tracking must be enabled, and the worksheet containing the selected row must have the X and Y data in the current X and Y columns. By default this is column A for the X coordinates, and column B for the Y coordinates. If your X and Y post map data columns are not in the default columns, click the Assign XYZ Columns command to assign new columns.
The coordinates in the worksheet row must be included within the map extents for the cursor to appear in the plot window.
Example in the Worksheet
- Using the example from above, select the contour map.
- Click the File | Open command to open the Demogrid.dat file. The data file is displayed in the worksheet.
- Click the Data | Data | Assign XYZ Columns command to ensure the X and Y coordinate columns are specified correctly. Make changes if necessary.
- Click the Data | Tools | Track Cursor command to enable cursor tracking.
- Click on a cell in the worksheet. The tracking cursor will move to the selected location on the maps in the plot window. Use the tabs to toggle between the plot and worksheet.
- Alternatively, click on the map in the plot window and the closest data point will be highlighted in the worksheet.
|
|
|
||
|
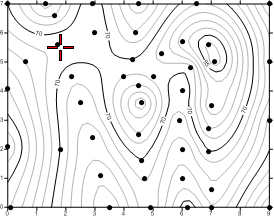
In the plot, click near a post point. |
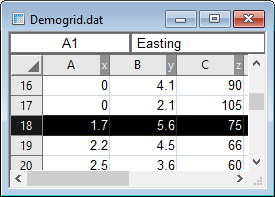
In the worksheet, the nearest post point is highlighted. |
Track Cursor in the Grid Editor
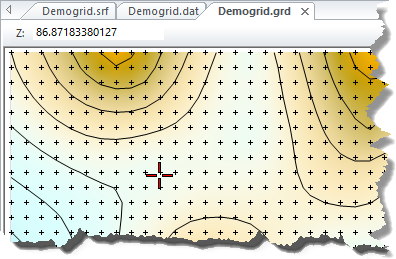
The Grid Editor | Options | Track Cursor command allows you to enable or disable the cursor tracking between worksheet data, maps in the plot window and grids in the grid editor. Click in the grid editor to position the tracking cursor. When clicking in the grid editor, the nearest grid node will also be selected. The tracking cursor is displayed in the same XY location on the map, and the closest point in the worksheet is highlighted. Click in the plot window or worksheet, and the tracking cursor will be displayed at the same XY location in the grid editor. However when clicking in the plot window or worksheet, the selected node will not change.
Example in the Grid Editor
- Using the example from above, select the contour layer.
- Click the Map Tools | Edit Layer | Grid command.
- Click the Grid Editor | Options | Track Cursor command to enable cursor tracking.
- Click on the grid in the grid editor. The tracking cursor will move to the selected location in the grid editor and plot window. The nearest grid node will be selected if the Select tool is active. Use the tabs to toggle between the plot and grid editor.
- Next, click on the map in the plot window. The tracking cursor will move to the new selected location. Use the tabs to toggle between the plot and grid editor. Click the tracking cursor in the grid editor if you wish to select the nearest grid node.
|
|
|
|
Click in the map in the plot window. |
In the grid node editor, the tracking cursor moves, but the selected node remains the same. |