Grid Editor
The Grids | Editor | Grid Editor command, the  button, and the Map Tools | Edit Layer | Grid commands open the grid editor as a new document.
-
The Grids | Editor | Grid Editor command and the
 button open a grid file with the Open Grid dialog.
 -
The Map Tools | Edit Layer | Grid command opens the grid file from the selected map layer in the plot document. You can also edit the grid for a map layer by right-clicking on the map layer and clicking Edit Grid. This command enables the Update Layer command in the grid editor. The Map Tools | Edit Layer | Grid command is not available for 1-grid vector and 2-grid vector layers. When accessed this way, the grid editor will display any Post, Classed Post, and vector or raster Base layers in the Map as context layers.
The grid editor contains various methods for editing the grid Z values. Editing the grid Z values will change the appearance of any grid-based maps. For example, the grid editor can be used to edit contours on a contour map or change the surface in a 3D surface map.
Each grid node is indicated with a black "+" in the grid editor window by default. Each NoData grid node is indicated with a blue "x" by default. The active node is highlighted with a red diamond. To move between grid nodes, press the arrow keys, or click a node with the Select tool active to make it the active node. The grid editor also includes contours, node labels, and a color fill. If the grid editor was opened by editing a layer in a map, any base and post layers are included for context as well. The grid appearance is controlled by the items in the Contents window and the properties displayed in the Properties window.
Note the Undo command does not undo changes in the Properties window in the grid editor.
Context Layers
When the grid editor is accessed either using the Map Tools | Edit Layer | Grid command or by right-clicking on the map layer and clicking Edit Grid, any Post, Classed Post, and vector or raster Base layers will be displayed as context layers to assist with editing the grid. Any layers being used as context layers will be displayed in the Contents window. Visibility for these context layers can be controlled by toggling the layers on and off in the Contents window, or, by toggling visibility for those layers in the 2D plot window.
The context layer will have labels in the grid editor if the layer has labels applied in the 2D plot window. These labels can be toggled on and off by selecting the desired context layer in the Contents window and toggling the Show labels option in the Properties window. If a layer does not have labels applied in the 2D plot window, then there are no properties for the context layers in the grid editor – all the properties are changed in the 2D plot window.
Note, no context layers will be displayed if the grid file being edited has been geotransformed. To remove a geotransform from a grid layer, set the map target coordinate system to the same coordinate system as the grid layer source coordinate system.
Images in the Grid Editor
The grid editor also allows you to open an image file and save as a grid file.
A grid requires a single floating point value at each grid node. Images contain colors which are three separate values (Red, Green, Blue) at each pixel.
Color Image
Color image formats are converted to a single floating point value by calculating the intensity of each color value using the intensity equation:
I = A(.30R + .59G + .11B)
where I = intensity, R,G,B,A are the red, green, blue, and normalized alpha values.
For example, a pixel from a color image with Red=255, Green=0, and Blue=0 would be mapped to a grid node with the value of:
I = .30*255 + .59*0 + .11*0 = 77
Grayscale Image
Grayscale images are imported directly. Grayscale images have a single color value and do not need to use the intensity equation. Surfer does not normalize the grayscale value. The value is used exactly as specified in the image.
For example, consider a grayscale image with a pixel that contains a value of 55. The grid node value would be set to 55.
Grid Editor Window
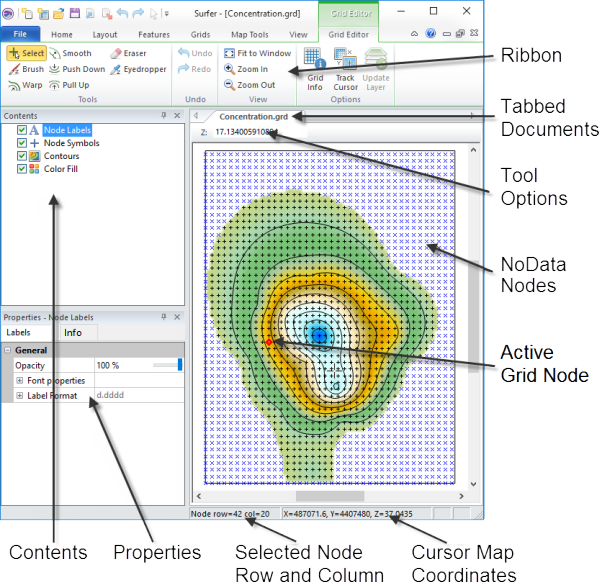
The following image and table explain the purpose of the grid editor window components.
|
|
|
This is the Surfer grid editor with the Contents and Properties windows on the left and grid editor window on the right. |
|
Component Name |
Component Definition |
|
The ribbon contains the Grid Editor commands. |
|
|
Toggle the display of the Node Labels, Node Symbols, Contours, Context Layers, and Color Fill with the Contents window. |
|
|
Edit Node Labels, Node Symbols, Contours, Context Layers, and Color Fill Labels properties and view Info properties in the Properties window. |
|
|
Plot windows, worksheet windows, and grid editor windows are displayed as tabbed documents. |
|
|
Tool Options |
The tool options bar contains the Z value box, Brush size, Density, and/or Pressure depending on the selected tool mode. |
|
The node that is currently selected. The active node is highlighted with a red diamond. |
|
|
Each grid node is indicated with a black "+" in the grid editor window by default. NoData nodes are indicated with a blue "x". |
|
|
The status bar includes information about the selected property, active node grid coordinates, and cursor map coordinates. |
Grid Editor Commands
The Grid Editor ribbon tab includes the following commands:
|
Select a grid node to edit the grid Z values one node at a time |
|
|
Apply a specific Z value to one or more nodes |
|
|
Drag grid values from one region into another |
|
|
Apply weighted averaging to grid nodes |
|
|
Decrease grid node values |
|
|
Increase grid node values |
|
|
Assign the NoData value to grid nodes |
|
|
Acquire a grid node value by clicking on the grid |
|
|
Undo the last operation |
|
|
Redo the last undone operation |
|
|
Fits the entire grid in the grid editor window |
|
|
Increase the grid editor window magnification |
|
|
Decrease the grid editor window magnification |
|
|
Zoom in to an area of interest |
|
|
Display information about the grid in a report window |
|
|
Track cursor location across plot, worksheet, and grid editor windows for maps, data files, and grids. |
|
|
Updates the associated map layer with the edited grid |
Using the Grid Editor
The grid editor can be used on existing map layers or on grid files without first creating a map.
To edit a map layer's grid:
- Select the map layer created from a grid file to edit in the plot document Contents window. Only the grid for this map layer will be edited even when multiple layers, such as contour or color relief, use the same grid file.
- Click Map Tools | Edit Layer | Grid in the plot window. The grid file is opened and is represented by a filled contour map. The location of each grid node in the file is marked with a black "+". NoData nodes are marked with a blue "x".
- Use the Grid Editor | Tools commands to make the desired adjustments to the grid.
- When you are done editing the grid, click the Grid Editor | Options | Update Layer command to update the map layer in the plot document with your grid.
- Click the plot document tab to view the changes to the map layer. If you wish to revert the changes to the map layer, click the Undo command while viewing the plot window. If you are satisfied with the changes to the map layer, you may wish to save the edited grid to a file.
- If you wish to save your edits to a file, click File | Save As to create a new grid file. Click File | Save to overwrite the existing grid file. It is necessary to save your edits to a file with Save or Save As if you wish to update all layers in your map to use the edited grid.
- To close the grid editor window, click the File | Close command or click the X in the grid editor document tab. To view an existing window and keep the grid editor window open, click on another document tab.
To edit a grid file:
- Click the Grids | Editor | Grid Editor command and select the grid file in the Open Grid dialog. The grid file is opened and is represented by a filled contour map. The location of each grid node in the file is marked with a black "+". NoData nodes are marked with a blue "x".
- Use the Grid Editor | Tools commands to make the desired adjustments to the grid.
- When you are done editing the grid, click File | Save As to create a new grid file. Click File | Save to overwrite the existing grid file. It is necessary to save your edited grid to a file with Save or Save As if you wish to create map layers with the grid.
- To close the grid editor window, click the File | Close command or click the X in the grid editor document tab. To view an existing window and keep the grid editor window open, click on another document tab.