Correlogram
The Grids | Calculate | Calculus Fourier and spectral analysis, Grid Correlogram, assesses spatial patterns and spatial correlation of a grid. Correlograms indicate how well grid values correlate across the grid. They indicate underlying trends in the grid and give a measure of the anisotropy of the grid.
Correlograms are symmetric; Z(x,
|
|
|
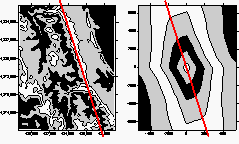
A contour map of a DEM is shown on the left and the grid correlogram is shown on the right. The heavy line illustrates the approximate directions of anistropy on both maps. |
Given gridded data z(u,v), where {u = 0, ..., NX-1} and {v = 0, ..., NY-1} the grid auto-covariance,
|
|
where the summation is over u and v such that
|
|
and ![]() is the arithmetic average of the grid values:
is the arithmetic average of the grid values:
|
|
Note that the grid auto-covariance function is itself a grid.
The grid auto-covariance is the two-dimensional lattice equivalent of the time series auto-covariance function. It is comparable to the two-dimensional variogram; under the appropriate assumptions of statistical stationarity, there is a one-to-one relationship between the grid auto-covariance function and the variogram. (Beware, however, that the variogram of a raw data set - prior to gridding - is not the same as the variogram of the resulting grid.)
The grid correlogram, corr(r,s), is a scaled version of the grid auto-covariance function:
|
|
C(0,0) is the variance of the data in the grid.
The functions C(r,s) and
|
|
but,
|
|
in general. As such, the grids generated by the grid correlogram option of the Grids | Calculate | Calculus sub-system show this symmetry.