Isosurface
The 3D View | Tools | Add to 3D Grid | Isosurface command creates an Isosurface from a 3D grid in the 3D View window.
An isosurface is a surface of constant value in a three-dimensional volume. The isosurface value is set in the Isovalue property in the Properties window. The isosurface separates regions less than the selected isovalue from regions greater than the selected isovalue. All points on the isosurface have the same value (the isovalue).
Creating an Isosurface
An isosurface can be created using the 3D View | Tools | Add to 3D Grid | Isosurface command from the 3D View window. This command will only be available when a 3D grid is selected in the Contents window. Additional isosurfaces can be created by clicking the command again.
Properties
Properties for isosurfaces are described below.
|
|
|
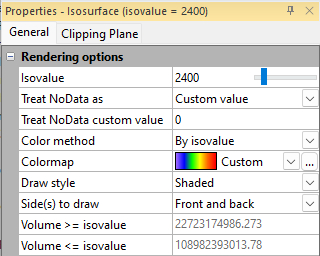
This image shows the Properties available for adjustment with Isosurfaces. |
Isovalue
The threshold value of the surface to generate. The generated surface separates data less than this value from data greater than this value. To change the Isovalue, highlight the existing value and type a new value or click and drag the dragger to increase or decrease the value. The image in the 3D View window updates as the value changes.
The units of the isovalue are the units of the input component values for the 3D grid.
Treat NoData As
The Treat NoData as selection defines how Surfertreats NoData values when rendering an isosurface. By default, NoData values are treated as the Data minimum. This default may result in unexpected results for certain data distributions. In those cases, select the Data maximum, or Custom option to render to surface as expected
The Treat NoData as selection defines how Surfer treats NoData values when rendering an isosurface. By default, NoData values are set to Ignore. This default may result in unexpected results for certain data distributions. In those cases, you may need to select Data maximum, Data Maximum, or Custom option to render to surface as expected.
-
Data Minimum | Treat blanked/NoData areas as if they were the minimum value seen in the 3D grid data.
-
Data Maximum | Treat blanked/NoData areas as if they were the maximum value seen in the 3D grid data.
-
Custom Value | When Treat NoData as is set to Custom, the Treat NoData custom value line is also displayed. Enter the C value that the NoData value should be treated as.
-
Ignore | Ignore NoData values, do not display anything in the 3D view or use to calculate volume data.
Color Method
The method used to generate the surface colors. The color of the isosurface may be set to a Fixed color or to By isovalue, which matches a colormap with the Isovalue. Mapping the Isovalue through a Colormap can be useful when displaying multiple isosurfaces. To change the Color method, click on the existing option and select the desired option from the list.
When the Color method is set to By isovalue, the Colormap option becomes available. To change the colormap used by the isosurface, click the existing color bar to the right of the Colormap command to select a different colormap from the list. Click on the desired colormap and the isosurface updates. Alternatively, click the ... button to open the Colormap Editor dialog. The Colormap Editor dialog allows you to create a custom colormap and to change the mapping of color to data values. When the Color method is set to By isovalue, a Color Scale can be created for the isosurface by selecting Color Scales in the Contents window and checking the box next to the desired isosurface.
When set to Fixed, the Color and Opacity options become available.
Color
The Color is the color of the isosurface. To change the color, click on the existing color and select the desired color from the list. Alternatively, click the ... button to open the Colors dialog, where you can set custom colors.
Opacity
The Opacity field controls the overall opacity of the isosurface. The value can be adjusted by highlighting the existing value and typing a new value or clicking and dragging the dragger to increase or decrease the value. A value of 0% is fully transparent while a value of 100% is fully opaque.
Draw Style
The Draw style is the style that is used to draw the isosurface in the 3D View window. Available options are Shaded, Lines, and Points. To change the value, click on the existing option and select the desired option from the list. Choose Shaded to render all polygonal geometry as shaded surfaces. Choose Lines to render all geometry as a wireframe connection of border lines. Choose Points to render all geometry as vertex points.
Side(s) to Draw
The Side(s) to Draw field controls which portion of the isosurface is visible. Available options are Front and back, Front only, and Back only. To change the value, click on the existing option and select the desired option from the list. Choose Front and back to draw both the front and back of the isosurface. Front only and Back only draws only a single side of the isosurface. The side drawn is relative to the camera's current position. The closer side is the front and the side furthest from the camera is back.
Volume
Surfer will automatically calculate the volume displayed by all enclosed areas of the isosurface. The volume greater than the isosurface is displayed next to the Volume >= isovalue option. The volume less than the isosurface is displayed next to the Volume <= isovalue option.
The units of the volume will be the X, Y, and Z units of the input data for the 3D grid. For example, a grid file created from Easting(m), Northing(m), and Elevation(ft) will result in volume units of m2*ft.
Bounding Box
Check the Show bounding box option to display a bounding box around the selected isosurface. The bounding box will adjust based on the geometry for the defined isovalue. The bounding box limits are not impacted by the addition or removal of a clipping plane.
When the Show bounding box option is checked, the bounding box properties are displayed.
XYZ Minimum
The XYZ Minimum property displays the minimum XYZ coordinates for the bounding box. This is a display only property.
XYZ Maximum
The XYZ Maximum property displays the maximum XYZ coordinates for the bounding box. This is a display only property.
Color
Select the bounding box color in the Color field. Select a color from the color palette or click  to set a custom color in the Colors dialog.
Opacity
The Opacity field controls the opacity of the bounding box. The value can be adjusted by highlighting the existing value and typing a new value or clicking and dragging the dragger to increase or decrease the value. A value of 0% is fully transparent while a value of 100% is fully opaque.
Width
The Width field controls the width of the bounding box lines. The value can be adjusted by highlighting the existing value and typing a new value or clicking and dragging the dragger to increase or decrease the value. The minimum value is 0 and the maximum value is 1.