3D View Window
Click the Map Tools | View | 3D View command ( ) or the 3D View button in the Map frame View properties page to open a 3D view of the selected map. This creates a new document tab (e.g., Plot1:2) where the map is rendered in a three-dimensional space.
Requirements for 3D View:
-
The map must include at least one layer that is not a base (raster) layer.
-
Grid-based layers (Contours, Color Relief, 3D Surface, etc.) are rendered as surfaces (XYZ grids) or volumes (XYZC grids).
-
Base (vector and raster), post, and classed post layers are overlaid on the surfaces as textures.
-
Drillhole layers are rendered as 3D drillhole paths.
Visibility and Customizations:
-
To show or hide specific elements in the 3D View, use the check boxes in the 3D View Contents window.
-
To completely remove an element, you must turn off the layer's visibility in the original Plot window.
-
Retaining Customizations: If you customize a 3D layer (such as adding isosurfaces or changing a color scale), your visualization customizations are saved. If you go back to the 2D plot view, toggle the layer off, and then turn it back on, your custom 3D visualizations will be fully restored when you return to the 3D view.
3D View Commands
The 3D View ribbon tab contains commands for modifying the view and creating videos and images in the 3D view window.
|
Group |
Command |
Description |
|---|---|---|
| View
|
Zoom to fit the entire map in the 3D view window |
|
|
Zoom in on the center of the 3D view window |
||
|
Zoom out from the center of the 3D view window |
||
|
Zoom by clicking and dragging the mouse |
||
|
Pan the 3D view window |
||
|
Rotate the 3D view window |
||
|
Walk along the surface in the 3D view window |
||
|
Select the direction from which the model is viewed in the 3D View window. Choices include Top, Bottom, East, West, North, and South. |
||
|
Depicting an object or map from a particular perspective, and affects how the three-dimensional model is drawn in the 3D View window. In Surfer, you have the option to view your model with a Perspective or Orthographic projection. |
||
|
Home
|
Move the 3D view to the home position |
|
|
Set the 3D view home position |
||
|
Fly-through
|
Create or edit a fly-through |
|
|
Play the fly-through |
||
|
Create a video with the current fly-through settings |
||
|
Tools
|
Save XYZ coordinates to a text file |
|
|
Convert visualization for 2D slices of 3D grids. |
||
|
Add to 3D Grid |
Add a new Isosurface, Image Slice, Block Render, or Contour Slice to the selected grid. |
|
|
Import and orient a 2D image. |
||
|
Clipboard
|
Copy an image of the 3D view window to the clipboard |
|
|
Copy the selected object's properties. |
||
|
Paste the clipboard format's properties to a newly selected object. |
||
|
Output
|
Export the current view in the 3D view window as an image |
|
|
Export the map in the 3D view window to a 3D PDF model |
||
|
Export the selected Vector Data layer in the 3D view window to a 3D vector file format. |
||
|
Record the 3D view to a video file. |
||
|
Drillhole Contacts
|
Create contact picks from drill hole data. |
|
|
Edit already created contact picks from drill hole data. |
||
|
Export contact picks from drill hole data. |
||
|
Drillhole Surfaces
|
Save surface geometry to a grid file. |
|
|
Save all surfaces to grid files. |
|
|
|
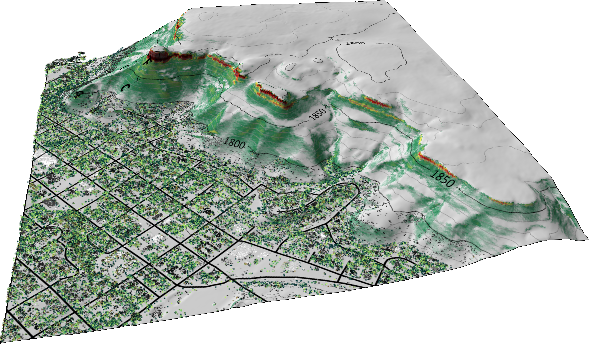
The 3D view displays the map in a three-dimensional space. This map includes contour, color relief, post, base, and point cloud layers. |
Contents
The Contents window contains the properties of the Environment and all objects within the 3D view. Surfaces are generated from the grids, and Vectors are generated from the point cloud, contour, and vector layers in the map.
Select the objects in the Contents window to change the properties of the 3D view and the map in the 3D view. A check mark next to the layer name indicates the layer is displayed in the 3D view. Clear the check box next to a layer to hide the layer in the 3D view.
Rename 3D Objects
Many objects within the 3D View can be renamed, providing greater clarity and organization, although certain headers are not re-namable.
-
Click the object to select it and press F2, or right-click and select Rename Object.
-
Type the new name and press ENTER.
-
To revert to the default name, clear the text and press ENTER.
|
|
|
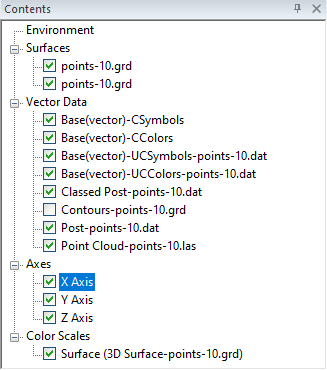
The Contents window includes the surfaces, vectors, axes, and color scales in the 3D View. |
Environment
The Environment object in the Contents window contains the properties for the 3D view. Select the Environment to modify the 3D view background, vertical exaggeration, water level, camera, and lighting. The Environment object has three Properties pages: General, Camera, and Lighting.
3D Grid Volumes Group
Contains any 3D grids (XYZC) present in the view. For each 3D grid, you can add and manage volume render, Isosurfaces, Image Slices, and Clipping Planes.
2D Grid Surfaces Group
The Surfaces group in the Contents window contains the surfaces in the 3D view. The Surfaces group object itself allows you to control the rendering quality for all surfaces via the General page.
Individual Surfaces
Each surface corresponds to a grid in your map. By default, each surface shows the texture from any map layer that uses the same grid file as the surface, and the textures from any base or post layers. Use the General page to hide or display textures.
-
Overlays: Textures such as contours, color relief, or base layers can be toggled on or off for each surface via the Textures to display section on the General page.
-
Appearance: To change the appearance of an overlay (e.g., line color), you must modify the layer properties in the original Plot window.
Vector Data Group
The Vector Data group in the Contents window contains the 3D vector objects in the 3D view, i.e. point cloud layers and 3D polyline contours. There are no Vector Data group properties.
-
Vector Layers: 3D point vector data is displayed for Post and Classed Post layers. 3D point, polygon, polyline, and polymesh vector data is displayed for Base (vector) layers. These layer types generally have three property pages: General, Features, and Z coordinate.
-
Point Clouds: Select individual point cloud layers to adjust settings like Point size. Point cloud layers have four property pages: General, Layer, Coordinate System, and Info.
-
Note: The maximum number of points displayed is controlled by the 3D View maximum number of points setting in the File | Options | Rendering page.
-
Contours
Contours are created for contour layers in the map. By default, the contour layer is displayed as a texture overlay on the surface. Vector contour lines are hidden by default.
Contours are displayed as texture overlays by default. To display them as 3D vector lines:
-
Select the check box next to the contours object in the Contents window.
-
In the Property Manager (General tab), you can set the Color Method to Same as plot (uses 2D plot properties) or Fixed (sets a uniform color and width for the 3D view).
Drillhole Group
Contains all 3D Drillhole Properties. While the group itself has no properties, individual drillhole layers contain the following property pages:
Axes Group
Three axes are automatically created for a map in the 3D view in Surfer. The Axes group in the Contents window contains the X, Y, and Z axes for the 3D map. All the axes are displayed by default. Clear an axis to remove it from the 3D map. Each axis has four Properties pages. Click on the axis in the Contents window to change its properties in the Properties window:
Color Scales Group
The Color Scales group in the Contents window contains color scales in the 3D view. A color scale is created for 2D layers that have a colormap. The Color Scales group adds or hides a color scale on the plot. The color scales can include any number of post, classed post, 1-grid vector, 2-grid vector, contour, point cloud and base colormaps from any of the maps in the plot. The total number of color scales is limited to the total number of layers that have their own color scales. The Color Scales group has one Properties page, Color Scales.
Individual Color Scales
Each color scale in the 3D view can have overlays from the map. The available overlay color scale for each 2D layer are listed under the Color Scales page in the Properties window. Select the color scale you wish to display on the 3D view. Clear the color scale to remove it from the 3D view. Color scales that are displayed may be edited by selecting the color scale in the Contents window. Color scales have four Properties pages:
Note: Color scales will not export to a 3D file but will export to images and be copied to the clipboard.