Breaklines and Faults
Breaklines and faults are a means to show discontinuities in the surface. Select gridding methods support breaklines and/or faults. Breaklines and faults are defined with Golden Software Blanking .BLN files.
If your grid is not dense enough, the breakline or fault will not show very well in the map. If you cannot see any indication of the breakline or fault (i.e. contours do not bend properly), regrid the data with a denser grid.
To include the breakline or fault as a line on your map, select the map and use the Home | Add to Map | Layer | Base. If the grid file used to create a contour map contains a fault, the contour properties General page has a Fault Line section, so you do not need to use a base map to show faults on contour maps.
|
|
|
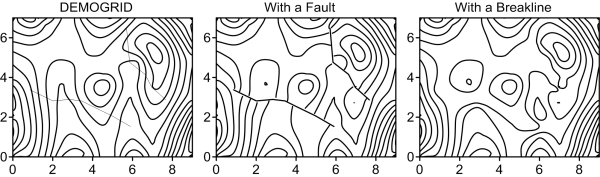
The map on the left is created from demogrid.dat using default gridding settings. The center map is created with two fault lines. The right map is created with breaklines. |
Definitions and Comparison
While both features utilize Golden Software Blanking (.BLN) files, they represent different physical phenomena and are processed differently by the gridding algorithms:
-
Faults: A fault acts as a total barrier to information flow. During interpolation, data points on one side of a fault are not used to calculate grid node values on the opposite side. This results in a vertical or near-vertical step (discontinuity) in the surface.
-
Breaklines: A breakline acts as a "hinge" or sharp fold in the surface. Unlike a fault, the interpolation engine considers data points from both sides of the line, but it forces the surface to pass directly through the breakline's specified Z values. This results in a distinct change in slope along the line.
Implementing Breaklines and Faults during Gridding
The options for breaklines and faults are located within the Grid Data workflow. These features are available only for specific interpolation methods, such as Kriging, Minimum Curvature, and Radial Basis Function.
-
Navigate to Home | Grid Data | Grid Data.
-
Select the desired data file and interpolation method.
-
In the Options page of the Grid Data dialog, locate the Breaklines and/or Faults sections.
-
Note: If the selected gridding method does not support faults, the Faults section will be omitted from the display.
-
-
Click the Open File icon to specify the .BLN file.
-
Breaklines: The .BLN file must contain X, Y, Z coordinates. If the Z column is missing, the file cannot be utilized as a breakline.
-
Click the
 button next to File Containing Breaklines to select the blanking file .BLN containing the breaklines. In the Open dialog, specify the blanking file and click Open. The blanking file will be displayed in the File Containing Breaklines. The number of traces and the number of total vertices are displayed under the file name. Click the Clear button to delete the file name to exclude the breaklines from the gridding process. Breaklines must contain 3 columns: X, Y, and Z. If the Z column is missing, the .BLN file cannot be used as a breakline.
-
-
Faults: The .BLN file requires X, Y coordinates to define the fault trace.
-
Click the
button next to File Containing Fault Traces to select the blanking file .BLN containing the fault traces. In the Open dialog, specify the blanking file and click Open. The blanking file will be displayed in the File Containing Fault Traces. The number of traces and the number of total vertices are displayed under the file name. Click the Clear button to delete the file name to exclude the fault traces from the gridding process.
-
-
-
Grid Density: Ensure the grid resolution (number of rows and columns) is sufficient to capture the detail of the discontinuity. Insufficient density may result in aliasing or poor representation of the feature.
Visualizing Discontinuities on the Map
Using a breakline or fault during gridding modifies the underlying grid file (.GRD), but it does not automatically render the line geometry in the plot window.
-
Base Map: To display the trace of the discontinuity, select the map and use the Home | Add to Map | Layer | Base command to import the .BLN file.
-
Contour Fault Lines: If a fault was used during the gridding process, the resulting contour layer includes a Fault Line section in the Properties window. This allows for the direct customization of fault line symbology within the contour properties.
Technical Considerations
-
Data Density: If the grid is not sufficiently dense, the breakline or fault may not be visibly apparent. If the contours do not reflect the expected discontinuity, regrid the data using a higher resolution.
-
BLN Format: Ensure that the .BLN file header correctly identifies the number of points and whether the line is open or closed (blanking flag).