A Gridding Example
Consider the scenario of producing a contour map of water table depth given well data collected over a region. The well locations are not regularly spaced over the area of interest. If you provide Surfer with the locations of the wells (the XY coordinates) and the depth to the water table (the Z value) in the form of an XYZ data file, Surfer can produce a grid file from the original data and a grid-based map from the gridded data. The following series of figures show the normal progression from a data file, to a grid file, to a contour map.
-
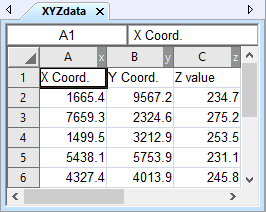
In a worksheet window, define well locations (X and Y coordinates) and water table depth (Z value) at each location in an XYZ data file.
|
|
|
This is the XYZ data file that defines the well locations and water table depth at each location. |
-
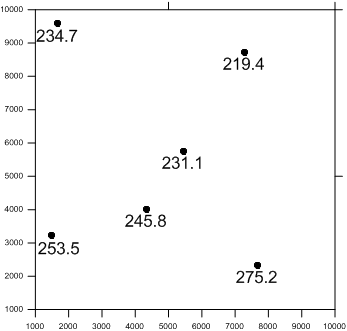
In the plot window, click the Home | New Map | Post command. Select the data file created in step 1and click Open to create a post map displaying the data locations with Z value labels. This step is to show the irregularly spaced data across the map.
|
|
|
This is a post map displaying the data locations. The well locations are irregularly spaced over the map in this example. There are many "holes" where no data exists. |
-
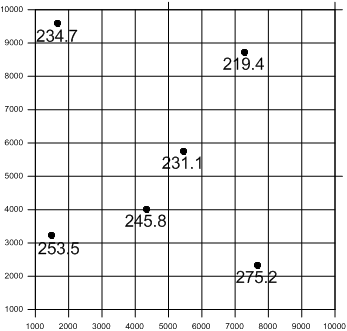
Click the Grids | New Grid | Grid Data command to create a regularly spaced grid .GRD file from the irregularly spaced XYZ data file. Use the default values in the Grid Data dialog and click OK to create the .GRD file.
|
|
|
Gridding interpolates a Z value at the intersection of each row and column in the grid file, thereby filling holes in the data. Here the rows and columns are represented by grid lines drawn across the map. |
-
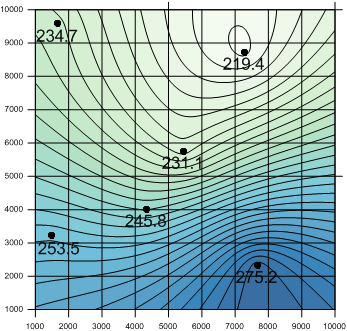
Click once on the post map to select it. Click the Home | Add to Map | Layer | Contour command to add a contour map of the grid file to the post map of the data file.
|
|
|
The irregularly spaced data points are used to interpolate grid node values. These interpolated values are written to a grid file. The grid file is used to produce the contour map. This figure shows the filled contour map, the posted data points, and the layout of the grid. |