Contour Map
The Home | New Map | Contour command creates a contour map from a grid file. A contour map is a two-dimensional representation of three-dimensional data. The first two dimensions are the X and Y coordinates. The third dimension is represented by lines of equal value. The relative spacing of the contour lines indicate the relative slope of the surface. The area between two contour lines contains only grid nodes having values within the limits defined by the two enclosing contours. The difference between two contour lines is defined as the contour interval.
The Home | Add to Map | Layer | Contour , the  button, or Map Tools | Add to Map | Layer | Contour command adds a contour map layer to the selected map.
|
|
|
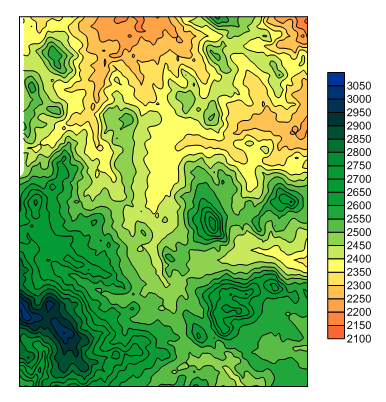
This example contour map shows filled color contours and a color scale bar. |
Creating a Contour Map
- Click Home | New Map | Contour command.
- Select a grid file in the Open Grid dialog. Click Open.
-
If the selected file is in a format that supports 3D grids (e.g. VTK, HDF) the Data Type dialog will be displayed.
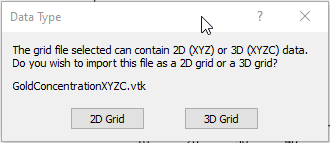
Click 2D Grid to import XYZ data or click 3D Grid to import an XYZC lattice with slice controls. If 2D grid is selected for a 3D grid file, the bottom slice (lowest Z value) will be imported.
The map is automatically created with reasonable defaults.
Editing an Existing Contour Map
To change the features of the contour map, click once on the contour map in the Contents window or plot window. When the contour map is selected, the contour map properties are displayed in the Properties window.
|
|
|
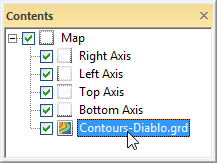
Click on the Contours map layer to select it. |
Contour Layer Properties
The contour layer properties contains the following pages:
Map Properties
The map properties contains the following pages:
Legend Properties
The Legend Properties section allows you to customize the appearance of your contour legend. You can define a custom template for how each legend item is displayed. This template can use directives to include specific information.
For the Simple, Logarithmic, or Equal Area contour Level methods, the legend will, by default, display only the major contour line properties. You can control the visibility of these contours by selecting the Show major contour or Show minor contour checkboxes.
When the Level method is set to Advanced, the legend properties provide flexible control over your contour display. By default, only the first level of the layer is shown in the legend. You can customize which levels are displayed by clicking the Levels to show button, which opens a dialog where you can check or uncheck individual levels.