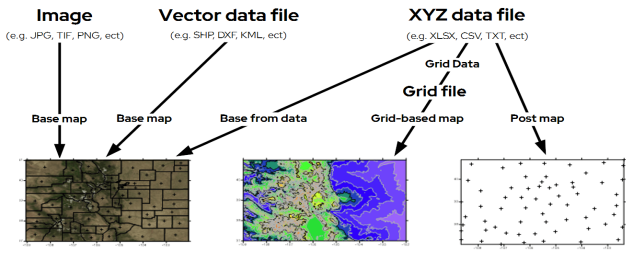
Surfer Flow Chart of Data and Maps
This flowchart is designed to clarify the relationships between various data file types — XYZ, grid, vector, and image — and the maps that can be created from them. The example illustrates the process of generating a contour map from a grid file. However, it's crucial to understand that this is just one example, and other relationships exist. For example, image files, including GeoTIFFs (which frequently contain elevation data), can also be used as grid files to produce grid-based maps.
|
|
|
This flow chart illustrates the relationship between different data files and different map types. |