Grid Values Layer General Properties
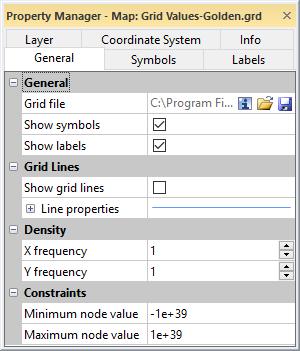
The General page for a grid values layer controls the display of symbols, labels, and lines, as well as the grid values density and constraints.
|
|
|
Specify general display options on the General page of the Properties window. |
General
The General section of the General page includes options for the layer grid file and display of symbols and labels.
Input Grid File
The Grid file lists the current grid file used in the contour map. The path and file name are the location of the grid file when the map was created or the grid file was most recently changed.
Grid Information
The ![]() button displays information about the grid file used to produce the map layer. The information includes the grid size, the minimum and maximum X, Y, Z, and C values contained in the grid file, and statistics. If the grid file contains more than 40 million nodes, you are asked if you wish to create a detailed report or a quick report. Click Yes in the message to create a detailed grid report, or click No to create a shorter quick grid report.
button displays information about the grid file used to produce the map layer. The information includes the grid size, the minimum and maximum X, Y, Z, and C values contained in the grid file, and statistics. If the grid file contains more than 40 million nodes, you are asked if you wish to create a detailed report or a quick report. Click Yes in the message to create a detailed grid report, or click No to create a shorter quick grid report.
Change File
The ![]() button displays the Open Grid dialog. This allows you to select a new grid file, or an updated version of the grid file used to create the contour map. Select a grid file and click Open. If the Z range for the new grid is outside the old contour levels, you will be prompted to continue the operation. If you clickCancel, the grid file is not replaced. If you clickOK, the grid file is replaced, but no contour lines are drawn. You can update the contour levels being displayed on theLevelstab.
button displays the Open Grid dialog. This allows you to select a new grid file, or an updated version of the grid file used to create the contour map. Select a grid file and click Open. If the Z range for the new grid is outside the old contour levels, you will be prompted to continue the operation. If you clickCancel, the grid file is not replaced. If you clickOK, the grid file is replaced, but no contour lines are drawn. You can update the contour levels being displayed on theLevelstab.
If the new grid exceeds the current map limits, another warning will appear asking you to adjust the map limits. If you click Yes, the limits are automatically adjusted to fit the new grid. If you click No, the limits are not automatically adjusted. The map may not be displayed. To change the map limits, click on the Map object in the Contents window and the Limits tab in the Properties window.
You may also see a warning message that the current map scale may result in an un-viewable map. Clicking OK allows the map scale to automatically be adjusted.
Coordinate System Note:
Regardless of the file selected with either the File | Reload Map Data command or by clicking the ![]() button in the Properties window, the coordinate system for the original map layer is used after updating the file. If this is not the correct coordinate system, click on the map layer to select it. In the Properties window, click on the Coordinate System tab and set the coordinate system to the appropriate new system.
button in the Properties window, the coordinate system for the original map layer is used after updating the file. If this is not the correct coordinate system, click on the map layer to select it. In the Properties window, click on the Coordinate System tab and set the coordinate system to the appropriate new system.
Save File
The  button displays the Save Grid As dialog. Type a File name and change the Save as type to the desired grid file format. Click Save. If a coordinate system has been defined on the Coordinate System tab in the Properties window, an Export Options dialog appears. Check the desired file formats. It is recommend that GS Reference (Version 2) file option be checked to generate a .GSR2 file. Click OK and the file is saved.
If the map layer was created using a 3D grid, only 3D grid file formats (HDF, VTK, etc) will be available in the Save as type field.
Grid Type
The Grid type field tells the user whether a 2D grid or 3D grid was used to create the map layer. This field is informational only.
Slice Z Value
The Slice Z value defines which horizontal slice of a 3D grid file is mapped. Click on the current value and enter a specific number to view the results for a that horizontal slice. Click and drag the slider to see the mapped results change as the slice value changes.
By default, Surfer will select a Z value near the middle of the range as the Slice Z value.
Save Slice
The Save Slice command saves the current horizontal slice of a 3D grid as a 3D grid file.
Click the button to display the Save Grid As dialog. Type a File name and change the Save as type to the desired grid file format. Click Save. If a coordinate system has been defined on the Coordinate System tab in the Properties window, an Export Options dialog appears. Check the desired file formats. It is recommend that GS Reference (Version 2) file option be checked to generate a .GSR2 file. Click OK and the file is saved.
Show Symbols
Symbols are displayed at grid node locations when the Show symbols check box is checked. Symbols are displayed by default. Clear the Show symbols check box to hide the symbols. The frequency of the symbols is controlled by the properties in the Density section.
Show Labels
Grid node value labels are displayed relative to the grid node locations when the Show labels check box is checked. Labels are displayed below the symbols by default. When symbols are not displayed, labels are positioned relative to the grid node location. Clear the Show labels check box to hide the labels. The frequency of the labels is controlled by the properties in the Density section.
Grid Lines
The Grid Lines section of the General page contains options for the display of grid lines and their properties.
Show Grid Lines
Check the Show grid lines check box to display grid lines for grid rows and columns. Clear the Show grid lines check box to hide the grid lines. The frequency of the grid lines is controlled by the properties in the Density section.
Line Properties
The Line properties control the display of the grid lines. See the Line Properties topic for more information on editing line properties.
Density
The Density section of the General page contains options for the density of the symbol, label, and/or line display.
X Frequency
The X frequency value specifies the frequency of drawn symbols, labels, and/or lines in the X direction. An X frequency value of 1 displays every grid node column. A frequency of 2 displays every other grid node column, 3 displays every third column, etc. The default value is the value in which approximately ten grid columns are visible across the map. Type a value in the X frequency field or click the  buttons to change the density of the symbols, labels, and/or lines in the X direction.
Y Frequency
The Y frequency value specifies the frequency of drawn symbols, labels, and/or lines in the Y direction. A Y frequency value of 1 displays every grid node row. A frequency of 2 displays every other grid node row, 3 displays every third row, etc. The default value is the value in which approximately ten grid rows are visible across the map. Type a value in the Y frequency field or click the buttons to change the density of the symbols, labels, and/or lines in the Y direction.
Constraints
The Constraints section of the General page controls the minimum and maximum values for grid nodes displayed on the map.
Minimum Node Value
The Minimum node value sets the smallest grid node value that will have a symbol and/or label displayed on the grid values map. By default the Minimum node value is -1e+39, i.e. -1 x 1039. Only grid nodes with a value greater than or equal to the Minimum node value will be displayed.
Maximum Node Value
The Maximum node value sets the largest grid node value that will have a symbol and/or label displayed on the grid values map. By default the Maximum node value is 1e+39, i.e. 1 x 1039. Only grid nodes with a value less than or equal to the Maximum node value will be displayed.