Estimator Type
There are a number of different formulae for estimating the variogram. Each method has different strengths, weaknesses, and proponents. Surfer contains four estimating options: the variogram, standardized variogram, autocovariance, and autocorrelation. When in doubt use the default classical variogram.
An observation is an (X, Y, Z) triple. A pair of observations contains two such triples. Consider the set of N pairs of observations that go into the calculation of a single plotted point on an experimental variogram. These N pairs are ordered pairs; the two observations are not randomly ordered within a pair. The first observation in the pair is the point with the smaller Y value and the second observation is the point with the larger Y value. The first observation is called the "head" (denoted by an "h"), and the second observation is called the "tail" (denoted by a "t).
Let
![]() be the observed value of the head observation of the ithpair, and
be the observed value of the head observation of the ithpair, and
![]() be the observed value of the tail observation of the ithpair.
be the observed value of the tail observation of the ithpair.
The required sums over the set of all N pairs are denoted:
|
|

The average and variance for all of the observed head values are:
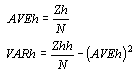
Similarly, the average and variance for all of the observed tail values are:
|
|

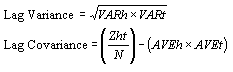
Then define the following two intermediate quantities:
|
|
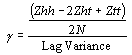
Variogram
The "classical variogram" estimator is:
|
|
(seePannatier, 1996, p. 38).
Standardized Variogram
The standardized variogram estimator is:
|
|
(see Pannatier, 1996, p. 39).
Autocovariance
The autocovariance estimator is:
|
|
(see Pannatier, 1996, p. 41).
Autocorrelation
The autocorrelation estimator is:
|
|
(see Pannatier, 1996, p. 42).