Volume Render
When a 3D View is created from a Map containing a 3D grid, a Volume Render will automatically be created, alongside a slice through the grid at the Z value defined in the 2D Plot window.
Volume rendering is a three-dimensional display of data that simulates the transmission and absorption of light through the points in the volume. Light rays are cast through the volume, where particles within the volume simultaneously emit and absorb light. The color of an individual pixel on the screen is computed by compositing the contributions from each particle intersecting the ray. This allows visualization of inhomogeneity inside objects with appropriate adjustment of the opacity.
|
|
|
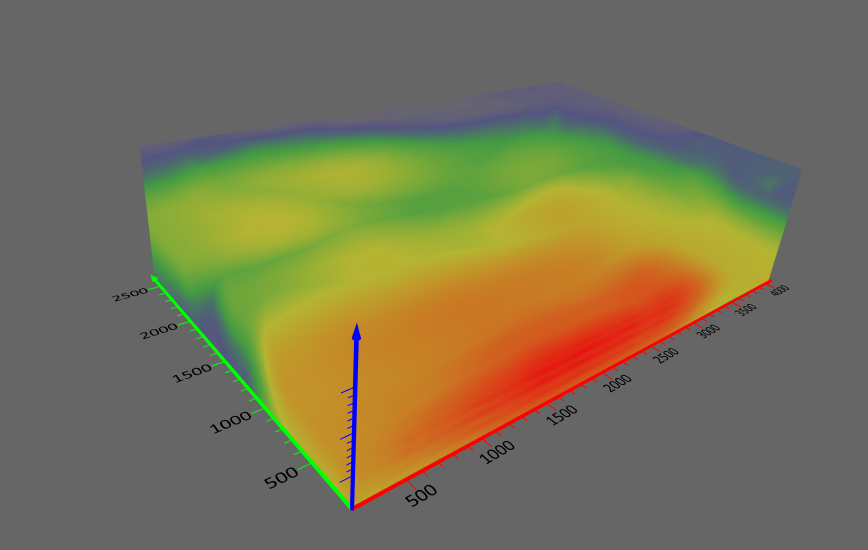
A Volume Render as seen in the 3D View window. |
Creating a Volume Render
Volume renders are automatically generated when a 3D View is created from a Map containing a 3D grid layer. Volume renders cannot be deleted, but their visibility can be toggled with the visibility checkbox in the Contents window.
Properties
Properties for volume renders are described below.
|
|
|
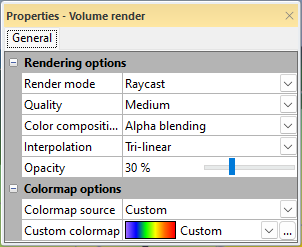
This image shows the Properties available for adjustment with Volume Renders. |
Render Mode
The Render mode property controls how the grid volume is rendered, either using Raycast or Sliced render mode. The default render mode is Sliced.
Raycast
The Raycast render mode uses a Quality field to control the appearance and rendering speed (or program responsiveness). The Quality field controls the quality of the volume render with Raycast render mode. Higher settings mean there are more samples through the volume. Available options are Low, Medium, and High. The setting can be changed by clicking the current selection and then selecting a new option from the list.
Sliced
The Sliced render mode uses the number of slices, Slice count, to control the appearance and rendering speed (or program responsiveness). The Slice count field controls the quality of the volume render with Sliced render mode. The Slice count is the number of slices displayed in the volume render. The default is 500 slices with a range of 10-2500 slices.
Render mode comparison notes:
| Raycast | Sliced | |
| Speed | Faster (more responsive) at default quality settings | Slower at default quality settings |
| Clipping | Not supported | Required for clipping |
| Appearance | Smooth appearance at default quality settings | May show lines depending on camera angle and slice count |
| Transparency | Applies a sample of all colors including background colors to the object. | Applies only the volume colors between that object and the camera. The more slices there are, the more strongly the result will appear like the colors of the volume render. |
| Looking inside | Volume renders are not displayed when the camera is inside the model (e.g. during fly-throughs or up close inspection). | Volume renders are displayed at all camera angles and positions. |
Color composition
The Color composition field sets the method used to create the render. Available options are Max intensity, Sum intensity, and Alpha blending. To change the composition, click on the existing option and select the desired option from the list.
Maximum intensity uses the brightest pixel along each viewing ray, resulting in a display similar to an X-ray image. Note that there is no shading effect in this method. Sum intensity adds the values of the pixels along each ray. Alpha blending combines the pixels using a blending function.
Interpolation
The Interpolation field is the method used within the 3D grid to interpolate values between nodes. Available options are Nearest neighbor and Tri-linear. To change the interpolation, click on the existing option and select the desired option from the list.
Nearest neighbor uses the grid node closest to the location for the value. Tri-linear interpolates several grid node values around the location to create the value.
Opacity
The Opacity field controls the overall opacity of the volume render. The value can be adjusted by highlighting the existing value and typing a new value or clicking and dragging the dragger to increase or decrease the value. A value of 0% is fully transparent while a value of 100% is fully opaque.
Colormap Source
The Colormap Source field controls the colormap used to color the volume render. By default, the volume render will use the existing colormap assigned to the slice used in the 2D Plot. To assign a colormap to the volume render independently, the Custom option can be used.
Custom Colormap
When the Colormap Source is set to Custom, the Custom Colormap field becomes available. This field is used to define a colormap for the volume render independently of the colormap used for the slice in the 2D Plot.
Color Scales
A Color Scale can be created for a volume render by clicking Color Scales in the Contents window and checking the checkbox next to the desired Volume Render in the Properties window.
Bounding Box
Check the Show bounding box option to display a bounding box around the selected volume render. The bounding box will surround the entire extents of the 3D grid. The bounding box limits are not impacted by the addition or removal of a clipping plane.
When the Show bounding box option is checked, the bounding box properties are displayed.
XYZ Minimum
The XYZ Minimum property displays the minimum XYZ coordinates for the bounding box. This is a display only property.
XYZ Maximum
The XYZ Maximum property displays the maximum XYZ coordinates for the bounding box. This is a display only property.
Color
Select the bounding box color in the Color field. Select a color from the color palette or click  to set a custom color in the Colors dialog.
Opacity
The Opacity field controls the opacity of the bounding box. The value can be adjusted by highlighting the existing value and typing a new value or clicking and dragging the dragger to increase or decrease the value. A value of 0% is fully transparent while a value of 100% is fully opaque.
Width
The Width field controls the width of the bounding box lines. The value can be adjusted by highlighting the existing value and typing a new value or clicking and dragging the dragger to increase or decrease the value. The minimum value is 0 and the maximum value is 1.