Contour Slice
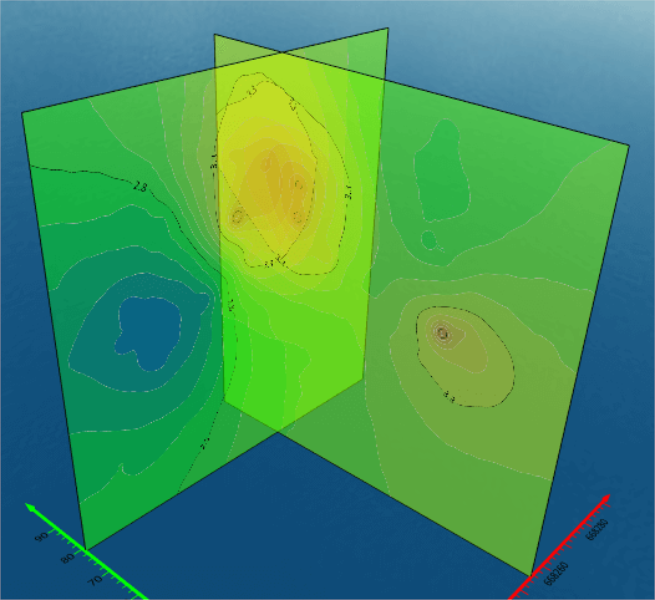
A contour slice creates a contour map of the 3D grid at a specified position, rotation, or along a specified vector path.
Select a 3D grid volume in the Contents window and click 3D View | Tools | Add to 3D Grid | Contour Slice to create a contour slice.
|
| A contour slice creates a contour map of the 3D grid at the specified position and rotation. |
Contour slice properties
Set the contour slice position and appearance in the Properties window. The properties are divided into several tabs: Slice, General, Levels, and Clipping Plane.
Slice | General | Levels | Clipping Plane | Filter
|
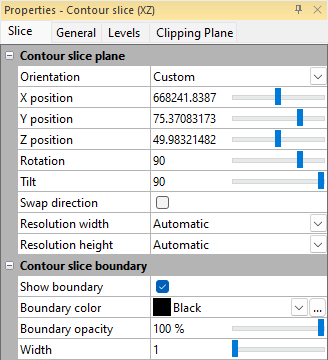
| Set the contour slice position and appearance in the Properties window. |
Slice (top)
Contour Slice
The Slice page controls the spatial positioning, orientation, and boundary appearance of the contour slice.
Orientation
Select XY, XZ, YZ, or Path in the Orientation field to quickly set the contour slice orientation to one of the axis planes. Otherwise, select Custom to fully define the contour slice position and orientation.
Path
When the Orientation is set to Path, the Path field becomes available. This allows you to slice the 3D grid along curved lines or multiple lines simultaneously, which is highly effective for creating complex fence diagrams.
-
Base Layer: Select a Base (vector) layer from the drop-down to generate slices along all polylines and polygons within that layer. This creates a single Contour Slice object in the Contents window, making it easy to apply the same contour levels and properties to all slices at once.
-
Specific Object: Select a specific polyline or polygon object (formatted as layername:objectname) to warp the slice to that exact path from start to end.
Position
The X/Y/Z position properties control the position of the contour slice. Type coordinate values or use the slider to set the contour slice position. Only one position property is displayed when an axis plane is used. All three coordinate positions are available when a Custom orientation is used.
Rotation and Tilt
When using a Custom orientation, you can modify the Rotation and Tilt properties.
- Positive Rotation values move the plane counterclockwise about the Z axis. Tilt must be greater than or less than zero for Rotation to affect the contour slice.
- Positive Tilt values move the plane clockwise about the Y axis.
- When Rotation and Tilt are both equal to zero, the orientation matches the XY plane.
- When Rotation and Tilt are both equal to 90, the orientation matches the XZ plane.
- When Rotation is equal to 0 and Tilt is equal to 90, the orientation matches the YZ plane.
Swap direction
Toggling the Swap direction check box toggles the side of the slice that the labels face, which is useful for making sure the labels are facing the direction of the camera.
Resolution
The Resolution width and Resolution height properties control the appearance of the contour slice by determining the total number of pixels used to display the slice. The Resolution width is the number of pixels used to render the contour slice along one side. The Resolution height is the number of pixels used to render the contour slice along the adjacent side. The directions of the Resolution width and Resolution height vary depending on the shape and angle of the intersection with the 3D volume.
The Resolution width and Resolution height can be specified independently to account for different contour slices. For contour slices that are generally square, the Resolution width and Resolution height should be set to the same value. For contour slices that are rectangular, i.e. one side is significantly longer than the other, the texture appearance may be improved by increasing the resolution along the long side of the contour slice.
By default the Resolution width and Resolution height are set to automatic. When both Resolution width and Resolution height are set to Automatic, the contour slice resolution along the longer direction is set to 1024 and the contour slice resolution along the shorter side is set based on the ratio between the contour idth and height. For example, a square contour will have 1024 pixels along the width and height while a long and skinny contour may only use 256 pixels along the shorter direction. When only one of the Resolution width or Resolution height values are set to Automatic, the Automatic value varies based on the specified value and the ratio between the surface width and height.
Contour slice boundary
Show boundary
Toggling the Show boundary check box toggles the boundary line along the edge of the contour slice.
Boundary color
Click the color next to Color to open the color palette. Click on a color to use it for the selected line. The color box updates to show the new selection. Click on the  button at the right of the color sample to open the Colors dialog, where you can specify a custom color.
Boundary opacity
The Boundary opacity is the amount of transparency of the boundary line. This is a value from 0% (completely transparent) to 100% (completely opaque). To change the value, highlight the existing value and type a new value. Press ENTER on the keyboard or click anywhere else in the Properties window to make the change. Alternatively, click and drag the  to change the opacity percentage.
Width
The Width controls the thickness of the boundary line in page units, a width of one is one pixel wide. To change the Width, highlight the existing number and type a new value. Press ENTER on the keyboard to make the change. Alternatively, click and drag the to change the boundary width.
Save
Save Slice Grid
The 2D grid data extracted from the 3D grid along the contour slice can be saved as a standard 2D grid file. To do this, use the Save slice grid button in the Properties window, click 3D View | 3D Grid | Save Slice Grid in the ribbon, or right-click the slice in the Contents window and select Save Slice Grid.
The resulting grid file matches the 3D volume data (including blanks). The grid layout and resolution depend on the orientation of the slice:
-
XY orientation: Grid X is volume X, Grid Y is volume Y. Resolution exactly matches the 3D grid.
-
XZ orientation: Grid X is volume X, Grid Y is volume Z. Resolution exactly matches the 3D grid.
-
YZ orientation: Grid X is volume Y, Grid Y is volume Z. Resolution exactly matches the 3D grid.
-
Custom orientation: Grid X is horizontal across the plane, Grid Y is vertical up the plane. If the slice is not rectangular (e.g., triangular), areas outside the volume are assigned the blanking value. Resolution is computed to match the 3D grid as closely as possible.
-
Path orientation: Grid X is along the path, Grid Y is volume Z. Resolution is computed to match the 3D grid as closely as possible.
-
Note: If the path has multiple disconnected pieces (like an entire base layer), a separate grid file will be generated for each piece, with "1", "2", "3", etc., appended to the specified filename.
-
Save Slice Image
The 2D image generated by the slice can be exported directly as a standard image file (such as a PNG, JPG, or TIF). To do this, click the Save slice image button in the Properties window, click the 3D View | 3D Grid | Save Slice Image command in the ribbon, or right-click the slice in the Contents window and select Save Slice Image.
The resulting exported image file will match the exact appearance of the slice as configured, including the applied Colormap, Opacity, and the pixel dimensions specified in the Resolution settings.
General(top)
General
Opacity
The Opacity is the amount of transparency of the Contour slice, independent of the Contour slice boundary. This is a value from 0% (completely transparent) to 100% (completely opaque). To change the value, highlight the existing value and type a new value. Press ENTER on the keyboard or click anywhere else in the Properties window to make the change. Alternatively, click and drag the to change the opacity percentage.
Golden Nugget : When a contour slice and an image slice are positioned on the same plane (e.g., to display contour lines over the gradient colors of the image slice), the contour lines and labels may appear "hollow." This occurs because overlapping surfaces on the same plane can cause transparency rendering issues. To resolve this, adjust the Opacity of the image slice layer to a value slightly less than 100%. For example, setting the opacity to 99% often produces excellent results.
Smoothing
The Smoothing option allows you to smooth the contours displayed on the map. Click on the existing value (None, by default) and select a new smoothing value from the list. If smoothing is enabled, contour lines may cross. The Smoothing option in the contour map properties applies a constrained spline smoothing algorithm to interpolate additional contour vertices. Each line is separately calculated, thus the lines can cross if too much smoothing is applied.
A better method to smooth contours is to regrid the data using the Grids | New Grid | Create Grid command, use the Grids | Edit | Spline Smooth or Grids | Resize | Mosaic commands to create a new grid with smaller grid node spacing. See Smoothing Contours for more information on smoothing.
NoData Regions
Fill Properties
Use the settings in the Fill Properties section to change the fill properties for NoData regions of the selected Contour slice.
Line Properties
Use the settings in the Line properties section to change line properties for the NoData regions of the Contour slice.
Levels(top)
The Contour slice levels properties are based on Contour Map Levels Properties and controls the display of contours, contour labels, and color fill on the contour slice.
Clipping Plane(top)
A clipping plane "clips" the Contour slice in the 3D view at the specified plane. Clip planes can be created in one of the three axis planes or with custom rotation and tilt.
Filter
The Filter properties allow you to apply a digital filter to a 3D grid visualization in the 3D View window. Filters perform mathematical operations on the data values within a specific neighborhood of grid nodes, altering the visual output.