Contour Map Levels Properties
The contour map properties Levels page controls the display of contours, contour labels, and color fill on the contour map. The levels can be set using a simple, logarithmic, equal area, or advanced method. All methods are described below. The advanced option is useful when more control over individual contour line properties is desired.
Display Simple, Logarithmic, or Equal Area Options
To use the simple options, click on the contour map to select it. In the Properties window, click on the Levels tab. Change the Level method to Simple. To use logarithmic options, change the Level method to Logarithmic.
Switching Between Level Methods
When switching the Level method to Advanced, all current Simple, Logarithmic, or Equal area options are initially shown in the Levels for Map dialog. However, when switching the Level method from Advanced to Simple, Logarithmic, or Equal area it is likely that some level customizations will be lost.
Some settings require the Level method be set to Advanced. For example, if you wish to load a .LVL file, you must use the Advanced setting.
|
|
|
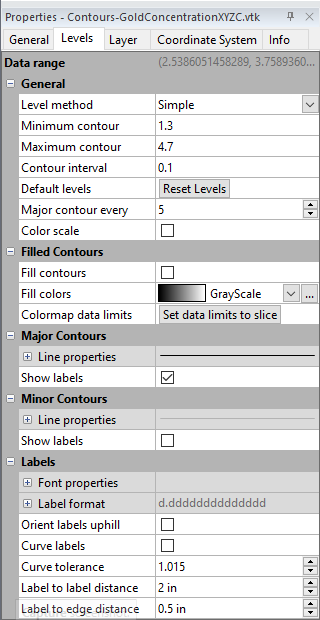
Adjust the contour map contour line properties on the Levels page in the Properties window. |
Data Range
The Data range displays the minimum and maximum values for the variable being contoured. For 3D grids, the minimum and maximum values correspond to the currently selected slice only.
General
The General section controls the method used to create the contour lines, the minimum contour value, maximum contour value, contour interval, how many minor contours are in a major contour interval, and the display of the color scale bar.
Level Method
The Level method determines which options are available for setting the contour map contour line properties. Available options are Simple, Logarithmic, Equal area, and Advanced. Simple allows basic options to be set. Logarithmic uses a log(10) interval to display the contours. Equal area separates the map into approximately equal area bins and creates contour lines at the bin boundaries. Advanced allows individual lines to have labels, hachures, fill, and line properties set individually. Advanced options are explained on the Contour Map Advanced Levels Dialog page. To set the Level method, click on the existing method and select the desired method from the list.
When the Level method is set to Logarithmic, the colormap for the filled contours automatically changes to use a logarithmic scaling, as well.
Minimum Contour
Set the Minimum contour to the value of the first contour line you want displayed on the contour map. To set a new value, highlight the existing value and type the new value. Press ENTER on the keyboard or click another command in the Properties window for the value to be accepted. Values are in map units for the variable being contoured. When the Level method is set to Logarithmic , the Minimum contour value must be greater than 0.
Maximum Contour
Set the Maximum contour to the value of the last contour line you want displayed on the contour map. To set a new value, highlight the existing value and type the new value. Press ENTER on the keyboard or click another command in the Properties window for the value to be accepted. Values are in contour variable units.
Contour Interval
The Contour interval option is available when the Level method is set to Simple . The Contour interval defines the spacing units between adjacent contour lines. This will affect how many contours appear on the contour map and how close those contours are to one another. To set a new value, highlight the existing value and type the new value. Press ENTER on the keyboard or click another command in the Properties window for the value to be accepted. Values are in contour variable units.
Surfer uses the Contour interval, the Minimum contour value, and the Maximum contour value to determine how many contour lines are created on the map. Surfer will issue a warning message if the number of contour lines increases above 5000. Click OK in the warning message and alter the Contour interval, the Minimum contour value, or the Maximum contour value so that the total number of lines is less than 5000.
Default Levels
The Default levels option is available when the Level method is set to Simple. If the Minimum contour, Maximum contour, or Contour interval has changed, you can return to the Surfer default values by clicking the ![]() button next to Default levels. Surfer returns the Minimum contour, Maximum contour, and Contour interval to reasonable values. This is similar to clicking the Use Defaults button on the Contour Levels dialog when using the advanced Level method.
button next to Default levels. Surfer returns the Minimum contour, Maximum contour, and Contour interval to reasonable values. This is similar to clicking the Use Defaults button on the Contour Levels dialog when using the advanced Level method.
For contour maps created from 3D grids, the default Minimum contourand Maximum contour are calculated using the C value range for the entire grid file. The contour interval is set based on the range for the selected slice. This ensures that contours will be drawn for every Z slice through the grid with reasonable spacing. Clicking the ![]() button adjusts the contour range based on data range of the current slice only. Depending on the C variable range of the grid file, this could result in few or no contours being drawn for some slices.
button adjusts the contour range based on data range of the current slice only. Depending on the C variable range of the grid file, this could result in few or no contours being drawn for some slices.
Number of Contours
The Number of contours property is available when the Level method is set to Equal area. The Number of contours property defines how many contour lines, and therefore equal area intervals, are displayed on the map. The number of intervals is equal to Number of contours plus one. In the rare case the grid has fewer unique values than necessary for the specified Number of contours, the number of contours on the map may be less than the Number of contours value.
Area per Interval
The Area per interval property is a read-only value that indicates the approximate area in each interval. Surfer calculates Area per interval by the area of the grid multiplied by the ratio of non-NoData to total grid nodes divided by number of levels plus one. The actual area of each interval will likely be very near, but not exactly equal, the Area per interval value. As the Number of contours increases, the Area per interval decreases. The Area per interval value is in layer units.
Major Contour Every
The Major contour every option is available when the Level method is set to Simple or Equal area. The Major contour every option sets the frequency for how often a major contour line appears on the map. Major contour lines and minor contour lines can have different line properties. By default, the first line is the Minimum contour. The Major contour every value tells the program how many contour lines to skip before the next major contour line. If the Major contour every value is set to 1, every contour line is a major contour line. If the value is 2, every other line is a major contour line. If the value is 3, every third line is a major contour line, and so on.
Minor Levels Per Decade
The Minor levels per decade option is available when the Level method is set to Logarithmic. The Minor levels per decade controls how many minor contour lines appear between major contour lines. When the Level method is set to Logarithmic, the major contour lines occur at multiples of 10 (0.001, 0.01, 0.1, 1, 10, 100, 1000, 10000, etc.). The number of contour lines between each major contour line is set by the Minor levels per decade. To change the Minor levels per decade, highlight the existing value and type a new value. Press ENTER on the keyboard to make the change. Alternatively, click the ![]() to increase or decrease the value. The default value is 8.
to increase or decrease the value. The default value is 8.
If the value is 8, minor contour lines appear at 2, 3, 4, 5, 6, 7, 8, and 9 between 1 and 10 or 20, 30, 40, 50, 60, 70, 80, and 90 between 10 and 100. 8 is the most common number of minor contour lines per major. Any value between 0 and 500 can be specified, though. Some common levels are defined below, with the values of the contour lines that would appear.
|
Minor Levels per Decade |
Values of Contour Lines |
|
8 |
1, 2, 3, 4, 5, 6, 7, 8, 9 |
|
7 |
2.125, 3.250, 4.375, 5.500, 6.625, 7.750, 8.875 |
|
5 |
2.5, 4.0, 5.5, 7.0, 8.5 |
|
4 |
2.8, 4.6, 6.4, 8.2 |
|
3 |
3.25, 5.5, 7.75 |
|
2 |
4, 7 |
|
1 |
5.5 |
|
0 |
no minor lines are displayed |
Contour Levels
When the Level method is set to Advanced, the Contour levels option is available. Click the Edit Levels button to open the Levels for Map dialog, where the advanced level options are set.
Color Scale
Check the box next to the Color scale option to display a color scale bar object. The color scale bar will be displayed in the plot window and the Contents window. The color scale bar can show the line properties for the contour lines, and the color scale bar shows the fill colors for a filled contour map. See color scale bar for more information on the color scale properties.
Filled Contours
The Filled Contours section controls the display of color fill between the contour lines.
Fill Contours
Check the box next to Fill contours to fill the space between each contour line with color. See Adding Color Fill between Contours for more information on filled contours.
Fill Colors
The Fill colors option defines the colormap used to fill the contour map. The colormap can use a linear or logarithmic scale. Change the color by clicking the existing color bar next to Fill colors. Select the new colormap from the list. If the desired color map is not listed, click the ![]() button to the right of the color. The Colormap Editor appears. Make any changes and click OK to see the change on the map. If the Level method is set to Advanced, the colors are set in the Levels for Map dialog.
button to the right of the color. The Colormap Editor appears. Make any changes and click OK to see the change on the map. If the Level method is set to Advanced, the colors are set in the Levels for Map dialog.
When changing the Level method to Logarithmic , the colormap scaling is automatically changed to logarithmic. When changing the Level method to Equal area , the colormap is not changed. However, when using Equal area level method, consider using the Equalize option in the Stretch field of the Colormap Editor.
Colormap data limits
By default, the data limits for a contour map created using a 3D grid are set to the C limits of the entire grid. The Set data limits to slice option sets the data limits for the colormap to match the data limits of the current Z slice being contoured. When the Z slice is changed, the colormap data limits remain the same until the Set data limits option is clicked again. If the colormap data limits are not reset, colors will be applied based on the previously defined range.
To return the colormap data limits to the C limits of the entire grid, click undo or note the C min and C max values on the Info page and then enter those values in the Min and Max fields in the Colormap Editor.
The Reset colormap field is visible only if the contour map was created using a 3D grid.
Major Contours
Click on the ![]() next to Major Contours to set the line properties for the major contour lines. You can also turn label display on or off.
next to Major Contours to set the line properties for the major contour lines. You can also turn label display on or off.
Line Properties
Click on the ![]() next to Line Properties to set the major contour line properties. Line Style, Color, Opacity , and Width can be set.
next to Line Properties to set the major contour line properties. Line Style, Color, Opacity , and Width can be set.
Show Labels
Check the box next to the Show labels option to display contour labels along major contour lines. When checked, all major contour lines contain labels. When unchecked, no major contour lines contain labels. If you want to set label visibility on an individual contour line basis, set the Level method to Advanced and use the options in the Levels page. Label font and format are controlled in the Labels section.
Minor Contours
Click on the ![]() next to Minor Contours to set the line properties for the minor contour lines. You can also turn label display on or off.
next to Minor Contours to set the line properties for the minor contour lines. You can also turn label display on or off.
Line Properties
Click on the ![]() next to Line Properties to set the minor contour line properties. Line Style, Color, Opacity, and Width can be set. By default, the minor lines use a 30% Black (light gray) color.
next to Line Properties to set the minor contour line properties. Line Style, Color, Opacity, and Width can be set. By default, the minor lines use a 30% Black (light gray) color.
Show Labels
Check the box next to the Show labels option to display contour labels along minor contour lines. When checked, all minor contour lines contain labels. When unchecked, no minor contour lines contain labels. If you want to set label visibility on an individual contour line basis, set the Level method to Advanced and use the options in the Levels dialog. Label font and format are controlled in the Labels section.
Labels
Click on the ![]() next to Labels to set the major and minor contour label properties. Font properties, label format, and label properties can be changed.
next to Labels to set the major and minor contour label properties. Font properties, label format, and label properties can be changed.
Font Properties
Click on the ![]() next to Font Properties to set the text properties for the contour line labels.
next to Font Properties to set the text properties for the contour line labels.
Label Format
Click on the ![]() next to Label Format to set the label format for the contour labels.
next to Label Format to set the label format for the contour labels.
When the Type is set to Date/time, if Invalid date text is displayed instead of the actual date/time format, the value for the label is outside the defined date/time range.
Label Orientation
The Orient labels uphill check box displays the labels so they are always oriented uphill. If this box is checked, the "tops" of the labels point uphill. If this option is unchecked, the labels always are oriented right-side up on the page.
Curve Labels
The Curve labels option creates contour labels that curve along the path of the contour lines. Select the Curve labels option to curve the contour labels. Clear the Curve labels option to create straight contour labels, regardless of contour line curvature.
Curve Tolerance
Curve Tolerance specifies the maximum amount of contour curvature allowed when placing labels on contour lines. Curve tolerance is calculated by dividing the actual distance along the contour line by the straight-line distance between the end points of the contour label. Highly curved lines might not be labeled automatically. You can increase the curve tolerance value to allow labels on highly curved contour lines, although contour labels might be hard to read. The default Curve Tolerance value of 1.015 should be acceptable in most cases.
Label to Label Distance
Label to Label Distance specifies the minimum distance (in inches or centimeters) between labels along the contour line. Surfer searches for the next suitable location for a label after moving the minimum distance specified by the Label to Label Distance. The next label is not drawn until a segment of the necessary length, within the curve tolerance limits, is found. As the Label to Label Distance is increased, fewer labels are drawn on the contours.
Label to Edge Distance
Label to Edge Distance specifies the minimum distance (in inches or centimeters) from the label to the edge of the map. This feature controls label placement so labels do not overwrite the map borders or axes.
See Also
Advanced Contour Level Options