3D Drillhole Properties
After a Drillhole Map is created, view the drillholes, wells, or boreholes in the 3D view by right clicking the drillhole layer and clicking 3D View, by selecting the map and clicking Map Tools | View | 3D View, or by clicking the 3D View button in the Map frame View Page page properties.
To define 3D drillhole properties, click the drillhole layer in the Contents window in the 3D view. The 3D drillhole Properties window appears.
This help topic has the following main sections that describe the 3D drillhole properties.
Points Page
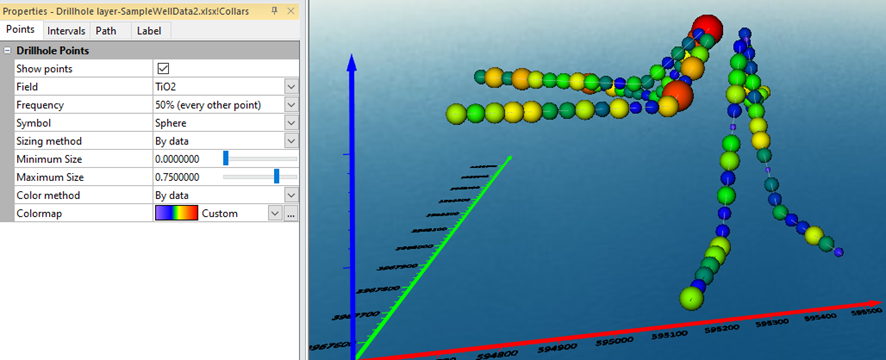
If points data were imported in the 2D map, these data can be displayed as point symbols in the 3D model. In the example below, the sample data has values in the TiO2 column in the points data (see C:\Program Files\Golden Software\Surfer\Samples\SampleDrillholeData.xlsx).
Show Points
To display points, click the Show points check box in the Points page in the Properties window.
|
Example 3D Drillhole Points properties using the TiO2 field in the sample points data |
Field
Select the field to display as the point value from the Field list. Only fields imported from the points data in the Drillhole Manager can be selected.
Frequency
Set the Frequency of point symbols to display. For example, 50% displays half of the points.
Symbol
Select the symbol to use for the points from the Symbol list: Circle, Square, Cube, Shaded circle, or Sphere. The Circle, Square, and Shaded circle are two dimensional symbols, and the Cube and Sphere are three dimensional. If you have a large quantity of points, a Shaded circle might be a better option than the Sphere if you need to reduce rendering time and cannot reduce the point density.
Sizing Method
Select either Fixed or By data for a Sizing method.
- Fixed creates point symbols that are the same specified size. After selecting Fixed, use the Size property to define the point size.
- By data sizes point symbols using data in the Field property. After selecting By data, use the Minimum Size and Maximum Size properties to set the size range.
Color Method
Select either Fixed or By data for the Color method.
- Fixed makes all symbols the same specified color. After selecting Fixed, select a color for the point symbols by clicking the current color and selecting the desired color in the color palette, or by clicking the
 button to define a custom color in the Colors dialog. See the Colors Dialog help topic for more information.
 - By data uses the data in the Field property to apply a color scale to the point data. After selecting By data, select a color scale for the symbols by clicking the current color scale and selecting a new one, or by clicking the button to modify or create a colormap in the Colormap Editor.
Color
The Color is the color of the points when the Color method is set to Fixed. To change the color, click on the existing color and select the desired color from the list. Alternatively, click the ... button to open the Colors dialog, where you can set custom colors.
Opacity
The Opacity field controls the overall opacity of the points when the Color method is set to Fixed. The value can be adjusted by highlighting the existing value and typing a new value or clicking and dragging the dragger to increase or decrease the value. A value of 0% is fully transparent while a value of 100% is fully opaque.
Intervals Page
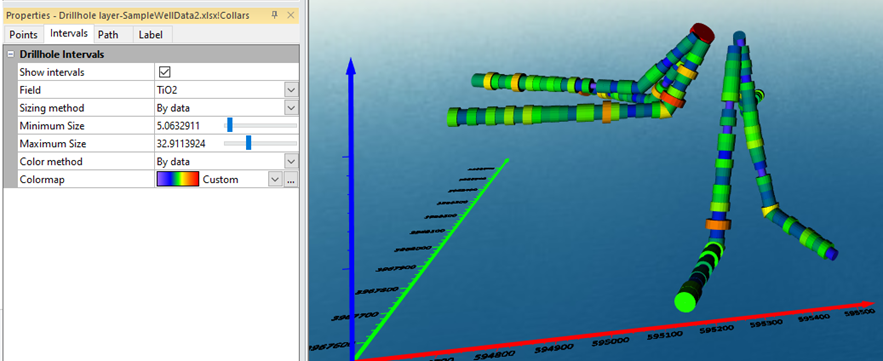
If interval data were imported in the Drillhole Manager in the 2D map, these data can be displayed in colored intervals in the 3D model. In the example below, the sample data has values in the TiO2 column in the interval data (see C:\Program Files\Golden Software\Surfer\Samples\SampleDrillholeData.xlsx).
Show Intervals
Check the Show intervals check box to display the intervals.
|
|
|
Example 3D Drillhole Intervals properties using the TiO2 field in the sample intervals data |
Field
Select the field to display as the interval value from the Field list. Only fields imported from the interval data in the Drillhole Manager can be selected.
Sizing Method
Select either Fixed or By data for a Sizing method for the width of the tube. The size (radius of the path cylinder) is 0-100, where the units are proportional to the map’s x-axis range.
- Fixed makes all intervals the same specified size. After selecting Fixed, define a size in the Size control.
- By data uses the data in the Field property. After selecting By data, use the Minimum Size and Maximum Size properties to set the size range.
Color Method
Select either Fixed or By data for the Color method.
- Fixed makes all symbols the same specified color. After selecting Fixed, select a color for the symbols by clicking the current color and selecting the desired color in the color palette, or by clicking the button to define a custom color in the Colors dialog. See the Colors Dialog help topic for more information.
- By data uses the data in the Field property to apply a color scale to the interval data. After selecting By data, select a color scale for the symbols by clicking the current color scale and selecting a new one, or by clicking the button to modify or create a colormap in the Colormap Editor.
Color
The Color is the color of the intervals when the Color method is set to Fixed. To change the color, click on the existing color and select the desired color from the list. Alternatively, click the ... button to open the Colors dialog, where you can set custom colors.
Opacity
The Opacity field controls the overall opacity of the intervals when the Color method is set to Fixed. The value can be adjusted by highlighting the existing value and typing a new value or clicking and dragging the dragger to increase or decrease the value. A value of 0% is fully transparent while a value of 100% is fully opaque.
Keyword Page
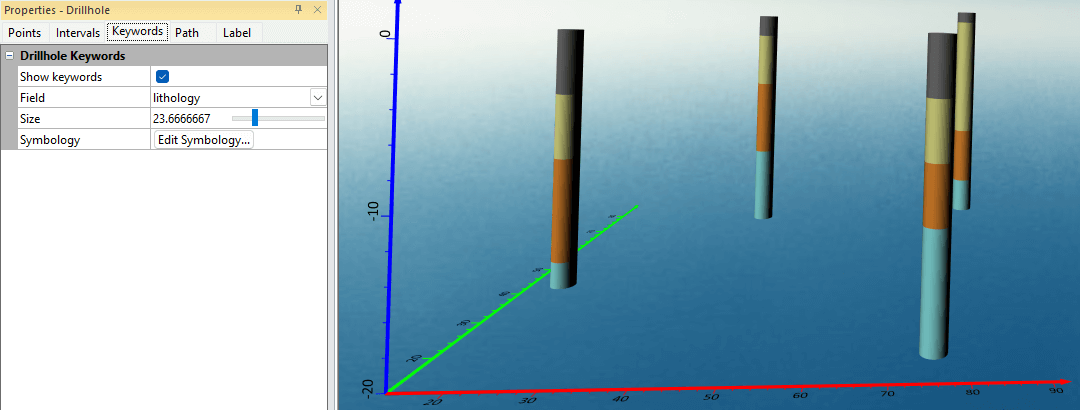
If the text keyword data were imported into the Drillhole Manager in the 2D map, these data can be displayed in colored intervals in the 3D model, keywords can also be displayed in a legend as discrete boxes. In the example below, the sample data is defined by the lithology data column.
Text keywords can signify lithology through names, codes, or descriptive terms, such as sandstone, sandy siltstone, conglomerate, volcanic breccia, dolomite, limestone, SST, or MST. They may also reflect mineralization characteristics (e.g., pyrite, chalcopyrite, chalcocite, arsenopyrite), grades (e.g., high, medium, low, none), orebody identifiers, or other relevant terms and phrases.
|
|
|
Example 3D Drillhole Keywords properties using the lithology field in the sample data |
Show keywords
Check the Show keywords check box to display a colored column of the Drillhole intervals using text keywords or a text data column to apply colors.
Field
Select the field that contains the keywords. Only fields that are formatted as text can be selected, if there are no text columns in the intervals data table, then this field will be empty.
Size
The size (radius of the drillhole cylinder) is 0-100, where the units are proportional to the map’s x-axis range.
Symbology
The 3D Drillhole Keywords dialog has three main sections: the top bar lets you define the drillhole keywords, the section on the left displays the values of specific keywords to which the colors will be applied, and the section on the right contains the properties that define those keywords.
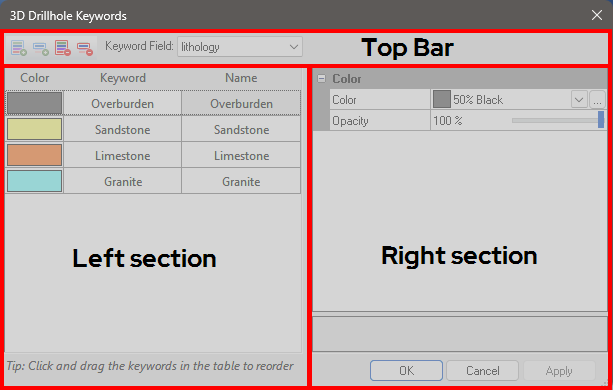
The 3D Drillhole Keywords dialog box, divided into three sections described below.
Top Bar
-
Click the Add All button
 to add all keyword values to the list.
 -
Click the Add button
 to display a list of keyword values from the data to select and add.
 -
Click the Remove All button
 to remove all keywords to the list.
 -
Click one or more values from the collars values and click the
 button to remove the selected rows.
 -
Keyword Field : Click the drop down to change the field that contains the keywords. Only fields that are formatted as text can be selected, if there are no text columns in the intervals data table, then this field will be empty.
Left section
The left section displays the values of specific keywords to which the colors will be applied. The color, keyword, and name of the keywords are listed here, click and drag the keywords in the table to reorder them.
-
Click in the Name section to change the display name for the keyword.
-
Select a keyword in the list to change the color and opacity of that keyword in the right section of the window.
Right section
After selecting a keyword in the left section, change the Color and Opacity for the keyword in the right section of the window.
-
Click the drop-down in the Color field to open the Color Palette or open the Colors Dialog to create a custom color by clicking the
button to the right of the selected color. -
The opacity is the amount of transparency of the fill. This is a value from 0% (completely transparent) to 100% (completely opaque). To change the value, highlight the existing value and type a new value. Press ENTER on the keyboard or click anywhere else in the window to make the change. Alternatively, click and drag the
 to change the opacity percentage.
Click the Apply button to preview the keyword changes, click the OK button to apply the settings and close the dialog, click the Cancel button to cancel the settings and close the dialog window.
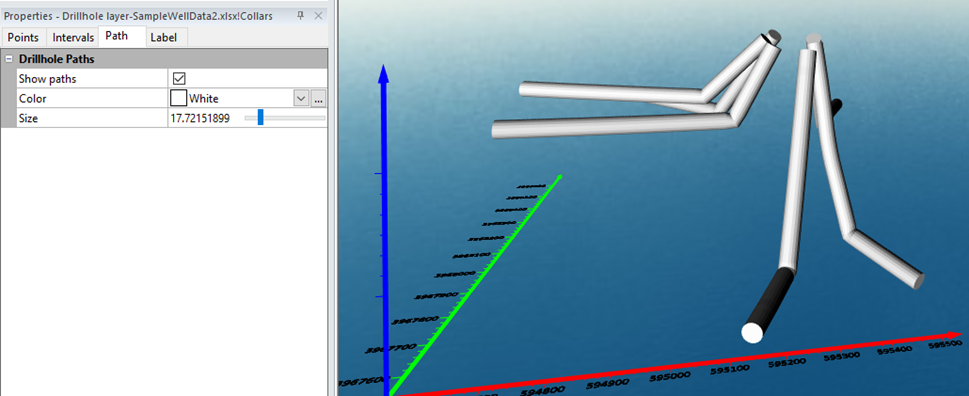
Path Page
These properties define the path of the drillhole using the depth, azimuth, and inclination values specified in the collars and survey tables.
Show Paths
Check the Show paths check box to display the path of the drillholes. Drillhole paths can still be displayed, even if point and interval data are not imported.
|
|
|
Example 3D Drillhole Path properties showing paths |
Color
Select the Color of the path. Click the current color and select the desired color in the color palette or click the ![]() button to define a custom color in the Colors dialog. See the Colors Dialog help topic for more information.
button to define a custom color in the Colors dialog. See the Colors Dialog help topic for more information.
Opacity
The Opacity field controls the overall opacity of the drillhole path. The value can be adjusted by highlighting the existing value and typing a new value or clicking and dragging the dragger to increase or decrease the value. A value of 0% is fully transparent while a value of 100% is fully opaque.
Size
Set the Size of the path. The path is the radius of the path cylinder in a 0-100 scaling, where the units are proportional to the map’s x-axis range.
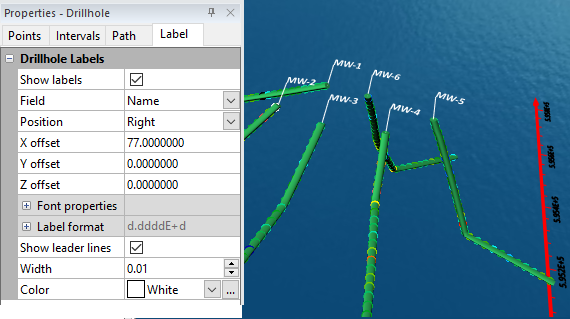
Label Page
The Label page for the 3D view drillhole layer includes options for drillhole label appearance and position.
Show Labels
Check the Show labels check box to display labels using a field from the imported collars table.
|
|
|
Example 3D Drillhole Label properties showing labels |
Field
Select the field to display as the label from the Field list. Only fields imported from the collars data in the Drillhole Manager can be selected.
Location
Select either Top of Drillhole or Start Depth for the label Location.
-
Top of Drillhole places the drillhole labels at the elevation defined in the Collars table.
-
Start Depth places the drillhole labels at the elevation equivalent to the start depth defined in the Collars table.
Position
In the Position list select a Default, Left, Center, or Right position of the label relative to the drillhole. Use the X offset, Y offset, and Z offset boxes to enter a specific, user-defined position.
Font
Use the Font properties to define the font of the label. See the Text and Font Properties help topic for more information.
Label Format
If the field contains Numeric or Numeric & Text data, the Label Format section appears. However, if the field contains only text data, the Label Format section does not appear. Use the Label format properties to define the format of the labels in the map. See the Label Properties help topic for more information.
Leader Lines
When a value is entered for the X, Y, or Z offset, check the Leader lines check box to display leader lines that connect the label to the top of the drillhole. If the Leader lines check box is checked, properties appear to define the Width and Color of the leader lines.
Drillhole Color Scales
Click the Color Scales object in the Contents window to display the Properties for the color scales. Color scales are available for drillhole points, keyword, and intervals when the drillhole layer uses By data for the point or interval Color method. When checked, the selected color scale will be displayed. When unchecked, the color scale will not be displayed. See the 3D View Color Scales Group help topic for more information.