Drillhole Map
A Drillhole Map is your primary tool for visualizing the path and properties of boreholes, shafts, or wells. Whether you are looking at a simple 2D surface plot or a complex 3D model of contaminant plumes, Surfer uses these maps to turn raw table data into a spatial story.
You can display these paths as simple lines and symbols in 2D, or as shaped 3D cylinders. By using Interval Data, you can even create segmented views that show how variables—like ore grade or lithology—change as you move down the hole.
Creating a Drillhole Map:
-
To start fresh: Click the Home | New Map | Drillhole command.
-
To add to an existing map: Select the map and click the Map Tools | Add to Map | Layer | Drillhole command.
Both of these commands will open the Import Drillhole Data dialog, where you will load and define your drilling datasets.
Table of Contents
Drillhole Data Requirements
Unlike standard maps that usually only require a single XYZ data file, drillhole maps often rely on multiple related tables to accurately build the geometry and display downhole data. Surfer allows you to “map” your headers (like TD or East_m) to the required fields during import so you have some flexibility of how your data is formatted.
Collars Data (Required)
The collars data file defines the surface location and the basic geometry of each drillhole. At a minimum, this file must contain a Hole ID and the X, Y, and Z coordinates for the top of the hole.
Surfer expects your data to be organized in columns. You do not need to use exact column names in your spreadsheet; Surfer will allow you to map your specific column headers to the required fields during the import process.
Collars Data Columns:
-
Hole ID (Required): A unique identifier for each drillhole.
-
X / Easting / Longitude (Required): The X-coordinate for the collar. Geographic coordinates (Longitude/Latitude) are fully supported.
-
Y / Northing / Latitude (Required): The Y-coordinate for the collar.
-
Elevation / Z (Required): The surface elevation of the collar.
-
Length (Optional): The total measured length of the drillhole from top to bottom. Note: Surfer uses the length and the inclination to automatically calculate the true vertical depth of the hole; you do not need to manually calculate the true depth.
-
Note: Use Length here rather than calculating vertical depth yourself. Surfer uses the length and the inclination to calculate the "True Vertical Depth" (TVD) for you!
-
-
Starting Depth (Optional): The starting depth of the hole. If left blank, Surfer defaults to 0.
-
Azimuth (Optional): The compass direction the hole is drilling toward, measured in degrees from 0 to 360.
-
Inclination (Optional): The angle of the drillhole. Important: Surfer measures inclination in degrees from vertical. An inclination of 0 means the hole is drilling straight down, while an inclination of 90 means the hole is horizontal.
Example Collars Data :
Here is an example of a properly formatted collars data file:
| ID | Easting | Northing | Elevation |
|---|---|---|---|
| MW-1 | 595299 | 3968125 | 2145 |
| MW-2 | 595203 | 3968210 | 2145 |
| MW-3 | 595176 | 3968113 | 2145 |
Survey Data (Optional)
To determine if you need a survey file, you only need to know if your holes are straight. If they are, the Collars file has all the info required. If they bend or deviate as they go deeper, you’ll want a Survey file to define the trajectory of curved or deviated holes over their length.
Survey Data Columns:
-
Hole ID (Required): The unique identifier matching the Collars data.
-
Depth / MD (Required): The Measured Depth (MD), which is the distance measured along the actual path of the drillhole.
-
Azimuth (Optional): The compass direction at the specified depth (0 to 360 degrees).
-
Inclination (Optional): The angle at the specified depth, measured in degrees from vertical (0 is straight down, 90 is horizontal).
Example Survey Data
Here is an example of a properly formatted collars data file:
| ID | MD | Azimuth | Inclination |
|---|---|---|---|
| MW-1 | 0 | 370 | 44.62 |
| MW-2 | 20 | 370 | 44.89 |
| MW-3 | 0 | 315 | 45.44 |
Golden Nugget : Don't worry if your company uses different column names like "Total Depth," "TD," or "Northing_m". As long as the data is in your sheet, the Import Drillhole Data dialog lets you select which of your columns corresponds to Surfer's required fields during the setup process!
Intervals Data (Optional)
Intervals data defines properties, classifications, or measurements that occur over a specific depth range (a "From" and "To" depth). This is the file you use to import your stratigraphy, lithology, assay results, or alteration zones.
Intervals Data Columns:
-
Hole ID (Required): The unique identifier matching the hole in your Collars data.
-
From (Required): The starting depth of the specific interval. This value must be 0 or greater.
-
To (Required): The ending depth of the interval. This value must be strictly greater than the From depth.
-
Data Columns: The actual variables or information associated with that depth interval. You can include as many data columns in this table as you need (e.g., text-based rock codes, numeric assay concentrations, etc.).
Example Intervals Data
Here is an example of a properly formatted Intervals data file:
| ID | From | To | TiO2 | MnO |
|---|---|---|---|---|
| MW-1 | 10 | 30 | 2.903 | 0.302 |
| MW-2 | 20 | 40 | 2.915 | 0.299 |
| MW-3 | 40 | 60 | 2.83 | 0.282 |
Points Data (Optional)
Points data defines numeric or text variables that are measured at a single, specific depth down the hole. This is the file you use to import discrete measurements like geological contact points, specific spot samples, or individual downhole sensor readings.
Points Data Columns:
-
Hole ID (Required): The unique identifier matching the hole in your Collars data.
-
Depth (Required): The exact depth along the actual path of the drillhole where the measurement was taken. This value must be 0 or greater.
-
Data Columns: The actual variables or information collected at that specific depth. You can include as many data columns in this table as you need (e.g., numeric assay values, text-based notes, etc.).
Example Points Data
Here is an example of a properly formatted Points Data file:
| ID | Depth | TiO2 | MnO |
|---|---|---|---|
| MW-1 | 10 | 2.903 | 0.302 |
| MW-2 | 30 | 2.915 | 0.299 |
| MW-3 | 50 | 2.83 | 0.282 |
Tips and Hints
You can create a 3D model of vertical drillholes or boreholes using just collars data, if your collars data include ending depth values. The example below shows the first four columns of the collar data in the sample data file, with added end depth values (shown in blue). During the data import of the collars data, associate the collars table End Depth field with the end depth values in your collars data. You can also associate the collars Start Depth field to start depth values in your data. If you don't have or don't associate start depth data, Surfer will use a start depth of 0.
Example collars data with added EndDepth values:
ID Easting Northing Elevation EndDepth MW-1 595299 3968125 2145 690 MW-2 595203 3968210 2145 670 MW-3 595176 3968113 2145 500
Create a Drillhole Map Example Walk-through
- In a new plot window click the Home | New Map| Specialty | Drillhole command. A Drillhole Data Import dialog appears.
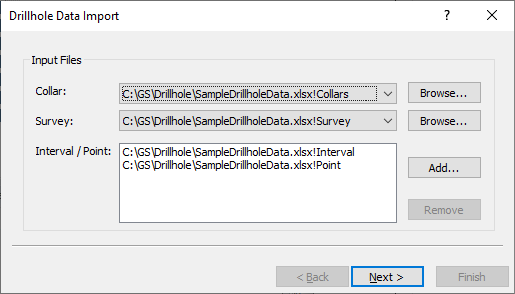
Example Drillhole Data Import data selection dialog using SampleDrillholeData.xls
-
In the Drillhole Data Import dialog, click the Browse and Add buttons to select each of the drillhole data files (collar and optional survey, interval, and point data), and then click Next to open the next Drillhole Data Import dialog. A Drillhole Data Import dialog will appear for each data file selected to be imported. The top section contains a table of the selected data source (Source Fields) and the bottom section contains the mapping of that data source to the table structure (Table Fields) that Surfer will use to create the drillhole map.
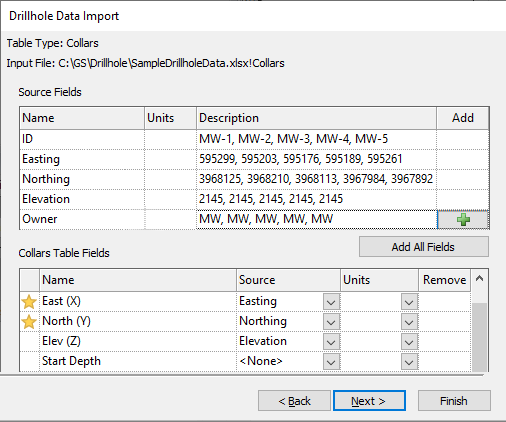
Example Drillhole Data Import dialog for collars data using SampleDrillholeData.xls
-
To import collars or survey data from a Drillhole Data Import dialog:
Note: If both the collars and survey table have azimuth and inclination data, Surfer will use the survey table data. If neither the collars nor the survey data has azimuth or inclination data, then Surfer will assume that the hole is vertical.
- In the Table Fields section, assign a Source field to each Name field. Rows marked with a
 are required. If a source field is not assigned to a predefined, non-required table field, the table field can be left empty (<None>) and have no values imported.
 - Use the Units fields to define the units for source data. If Units are defined in the source field, the value will automatically be added to the selected table field. If needed, data conversion will occur for the selected unit of the table field. The select units will also show in the Drillhole Manager.
- Click the
 button next to any additional data in the Source Fields section to import that data or click the Add All Fields button to add all data. For any additional rows that were added to the Table Fields section, click the
  button to not import that data. Any data not listed in the Table Fields will not be imported.
 - After associating the Name to the Source data and defining any Units, click Next to display the next data import dialog.
- In the Table Fields section, assign a Source field to each Name field. Rows marked with a
-
If interval or point data were selected to be imported, a Drillhole Data Import dialog appears for every data source. If the imported data are interval data, click Interval (From/To) Data. If the imported data are point data, click Point (Depth) Data. Interval data usually has rows with Hole ID, From, and To, and point data will have Depth data.
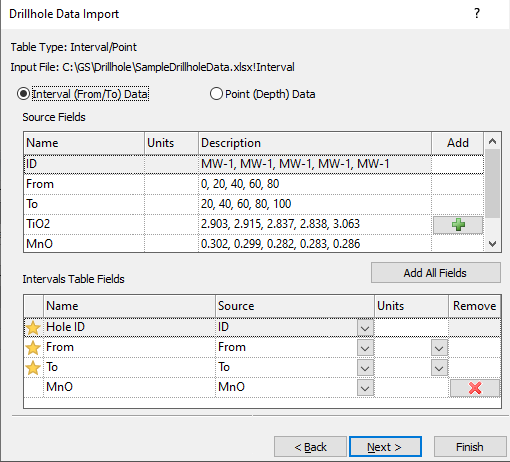
Example interval data Drillhole Data Import dialog.
- In the Table Fields section, assign a Source field to each Name field. Rows marked with a are required. If a source field is not assigned to a predefined, non-required table field, the table field can be left empty (<None>) and have no values imported.
- Click the button next to any additional data in the Source Fields section to import the data or click the Add All Fields button to add all data. For any additional rows that were added to the Table Fields section, click the button to not import that data.
- After associating the Name to the Source data and defining any Units, click Next. If additional imported data need to be defined, another Drillhole Data Import will appear.
- In the Table Fields section, assign a Source field to each Name field. Rows marked with a
-
If one or more LAS files were selected to import, each LAS file will import data into the Collars and Points tabs in the Drillhole Data Import dialog for LAS files. The Collars tab is similar to the collars table Drillhole Data Import dialog described above and takes data from the well information block and the parameter information block in the LAS file. The Points tab takes data from the curve information block in the LAS file.
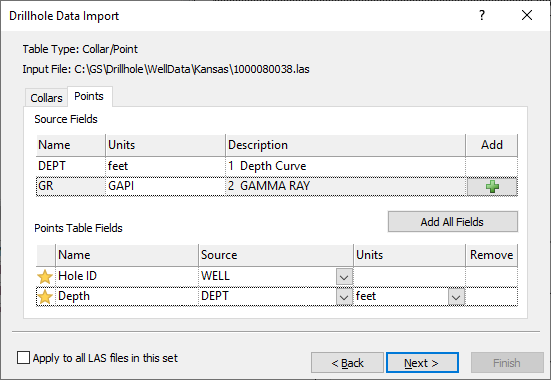
Example Points tab for LAS data import in the Drillhole Data Import dialog
- In the Table Fields section, assign a Source field to each Name field. Rows marked with a are required.
- If all LAS files have the same data format, check the Apply to all LAS files in this set check box to apply this data import definition to all LAS files selected to be imported.
- Click the button next to any additional data in the Source Fields section to import that data or click the Add All Fields button to add all data. For any additional rows that were added to the Table Fields section, click the button to not import that data.
- After associating the Name to the Source data and defining any Units, click Next to display the next data import dialog.
- In the Table Fields section, assign a Source field to each Name field. Rows marked with a
-
After defining all imported data, the final Drillhole Data Import dialog appears.
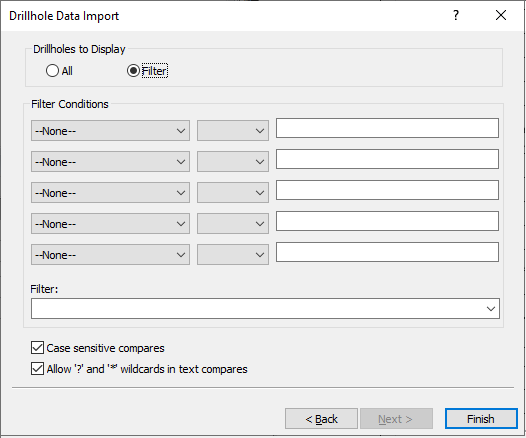
Example Drillhole Data Import filter dialog.
- Under Drillholes to Display, either click All to display all imported drillhole data on the map or click Filter to filter the data to only display a filtered group of drillholes. Use the five Filter Conditions rows to build a filter using fields in the collars table. Click a filter to view or select a previously used filter. If you choose to display all drillholes, you can still filter the display of drillholes using the Drillholes to display property on the General page of the drillhole layer properties.
- The Case sensitive compares and Allow ? and * wildcard in text compares options control how text is compared in the query.
- When the Case sensitive compares check box is checked, the text returned by the filter conditions must have the same case.
- When the Allow ? and * wildcard in text compares check box is checked, a ? can be used to represent any single character and an * can be used to represent a group of characters.
- After defining any needed filters, click the Finish button to create and display the drillhole map.
-
After creating a drillhole map, view a 3D Drillhole Properties, define drillhole properties, Add a Drillhole Layer Walk-through, or use the Drillhole Manager to manage imported data.
Add a Drillhole Layer Walk-through
To add a drillhole layer to an existing map:
- Select the map and click Home | Layer | Add to Map | Drillhole or right click over the map layer and select Add to Map | Drillhole.
- If drillhole data has already been imported into the plot document, then the New Drillhole Layer dialog appears.
- If you have new drillhole data you want to display in the new layer, click the Add New Data button to display the Drillhole Data Import dialog. Follow the steps above in the Create a Drillhole Map Example Walk-through section, beginning with Step 2.
- If you want to use the same drillhole data to create the new layer, perhaps using different filter conditions, select the desired settings under Drillholes to Display and Filter Conditions and click OK.
- If drillhole data has not already been imported into the plot document, then follow the steps above in the Create a Drillhole Map Example Walk-through section, beginning with Step 2.
Golden Nugget : When adding new drillhole data, you may receive a warning about adjusting map limits to include all data. If you select to adjust the map limits, and then decide to not include the new data, you can readjust the map limits to the original data (see the Limits Properties help topic).