Profile Plot Properties
Click the Map Tools | Add to Map | Profile command or right-click on a map and click the Add to Map | Profile to add a profile to an existing map.
Profile Properties
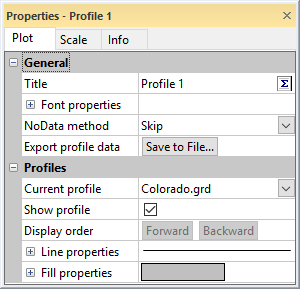
You have flexibility over the display and color of the profile. The Plot page controls the profile title and display order, line, and fill properties for the profile lines in the profile plot.
|
|
|
The profile properties are set in the Properties window. |
General Section
The General section of the Plot page includes the title properties and Export profile data command.
Title
Profile titles can use any text properties including math text formatting instructions. Type the profile title exactly as you want it to appear on the Title line.
Titles can contain multiple lines. To create a multiple line title, click the  button. The Text Editor appears. Type the text in the dialog. To add a new line of text, press the ENTER key on the keyboard. To change the properties of the text, highlight the text and change the desired property. When finished, click OK. You are returned to the Properties window.
Font Properties
To edit all of the text properties for the entire title at once, click the ![]() next to Font properties. You can then set any desired font settings, including font, size, and text color.
next to Font properties. You can then set any desired font settings, including font, size, and text color.
NoData Method
The NoData method property controls how NoData areas in the map are displayed in the profile. Available options are Skip, Minimum, and Custom Value. When the NoData method is set to Skip, the areas where NoData values are encountered are not displayed on the profile. When set to Minimum, the areas where NoData values are located are displayed with the minimum Elevation value of the profile. When set to Custom Value, the Custom value option becomes available. Type a value into the Custom value field, and the NoData areas are drawn in the profile with an elevation equal to the Custom value.
Export Profile Data
Click the Save to File button in the Export profile data field to save the profile elevation and distance data. In the Save As dialog, type a File name and click the Save button. A .DAT file is created.
The .DAT file contains one column of distance data and one or more columns of elevation data. The first column, Column A when opened in the worksheet, includes the accumulated distance along the profile line. The remaining columns include the elevation data for each profile in the profile plot. The DAT file also includes a header row with "Distance" in the first column and the profile name in the remaining columns.
Profiles Section
The Profiles section includes the display state, display order, and line and fill properties for each of the profiles in the profile plot.
Current Profile
Select the profile you wish to edit in the Current profile field. The selected profile is indicated in the profile plot with blue circles along the profile. Click the current selection and select the desired profile from the list. All profiles in the profile plot are included in the Current profile list. Profiles use the name of their corresponding grid file, when available. When a grid file name is not available, profiles use their corresponding layer name.
The Current profile list also indicates the order of the profiles in the plot. The profile at the back of the plot is listed first. The profile at the front of the plot is listed last.
Show Profile
Check the Show profile check box to display the Current profile in the profile plot. Clear the Show profile check box to hide the Current profile from the plot. Limits for the profile plot adjust automatically as profiles are turned on and off.
Display Order
Control the display order Current profile with the Display order property. Click Forward to move the Current profile forward one position in the plot. Click Backward to move the Current profile backward in position in the plot. When the profile plot contains only one profile, the Forward and Backward buttons are disabled.
Line Properties
Specify the line properties for the Current profile by clicking on the ![]() next to Line Properties and setting the desired option. The line style, color, opacity, and width can be set.
next to Line Properties and setting the desired option. The line style, color, opacity, and width can be set.
Fill Properties
Specify the fill properties for the Current profile by clicking on the ![]() next to Fill Properties and setting the desired option. The fill pattern, color, and opacity can be set. The fill goes from the profile line to the X Axis. You may wish to use semi-transparent fill or no fill when profile lines intersect.
next to Fill Properties and setting the desired option. The fill pattern, color, and opacity can be set. The fill goes from the profile line to the X Axis. You may wish to use semi-transparent fill or no fill when profile lines intersect.