Cross Validation
Generally, cross validation can be considered an objective method of assessing the quality of a gridding method, or to compare the relative quality of two or more candidate gridding methods. In Surfer, cross validation can be used with all gridding methods. While cross validation can be used to select a gridding method, the results can also be used to assess the spatial variation in gridding quality and to guide data sampling. Cross validation is always performed on the linear Z values, not the transformed Z values.
A generalized discussion of cross validation is given here. Refer to one of the many geostatistics books for more information. In the listed references below, much of the discussion concerns kriging, but the generalized discussion applies to all of the gridding methods in Surfer.
Cross Validation Process
Given the known values at N observation locations in the original data set, cross validation allows you to assess the relative quality of the grid by computing and investigating the gridding errors. In Surfer, these errors are calculated by removing the first observation from the data set, and using the remaining data and the specified algorithm to interpolate a value at the first observation location. Using the known observation value at this location, the interpolation error is computed as:
error = interpolated value − observed value
Then, the first observation is put back into the data set and the second observation is removed from the data set. Using the remaining data (including the first observation), and the specified algorithm, a value is interpolated at the second observation location. Using the known observation value at this location, the interpolation error is computed as before.
The second observation is put back into the data set and the process is continued in this fashion for the third, fourth, fifth observations, etc., all the way through up to and including observation N, the last observation in the data file. This process generates N interpolation errors. Various statistics computed for the errors can be used as a quantitative, objective measure of quality for the gridding method.
Thus, cross validation involves four steps:
-
Select a gridding method, along with all of the defining parameters.
-
For each observation location, interpolate the value using the neighboring data, but not the observation itself.
-
Compute the resulting interpolation errors.
-
Assess the quality of the selected gridding method using various summary statistics of the errors.
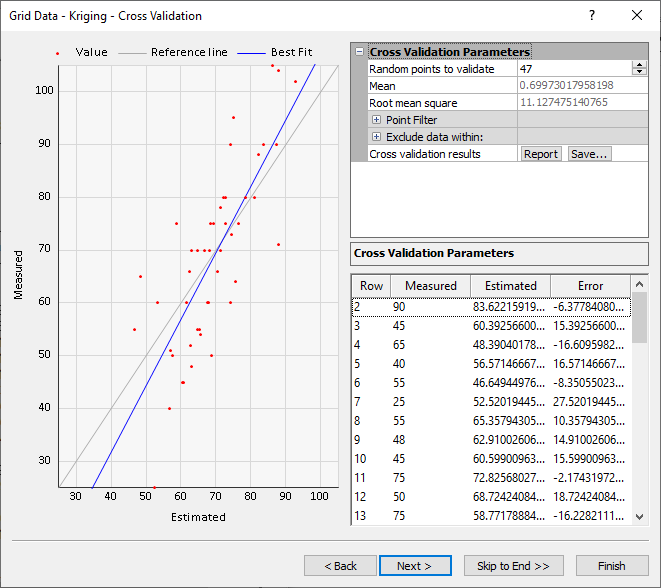
Grid Data - Cross Validation
The Cross Validation page is displayed after the Options page in the Grid Data dialog.
|
|
|
Evaluate gridding methods with cross validation. |
Number of Random Points to Validate
For large and very large data sets the cross validation process of sweeping through each and every observation point can take a great deal of time and computational effort. A quicker alternative is to carry-out the cross validation procedure at a random subset of the observation locations.
Number of random points to validate allows you to specify the number of cross validation points. By default, this value is equal to the total number of observations or 100, whichever is lesser. For large and very large data sets this value should be 1,000 or more to ensure a relatively stable set of error statistics. Note, the entire data set is used through-out the cross validation process, not just the random subset. The random subset merely identifies the locations at which cross validation errors are computed. Also, note that the random subset is determined without replacement, using a random number generator that is randomly initialized for every execution; thus, the random subset may be different every time cross validation is run.
Points Filter
Set the X, Y, and Z direction values for Minimum and Maximum in the Point Filter section. This restricts the cross validation to a subarea of the data extent. Data falling outside of these limits may be used during the interpolation, but they are not used as cross validation points. The limits in Z direction are useful to exclude cross validation at known anomalous observation locations.
Exclude Data Within
Often observations come in relatively homogeneous clusters. In these circumstances, the standard cross validation approach may not generate useful results as the interpolated values are merely the values of the close-by adjacent observations. To counter this potential problem, the X tolerance and Y tolerance fields define a centered rectangular buffer zone around each of the observations at which cross validation is carried out. This buffer zone is two times the X tolerance in the X direction, and two times the Y tolerance in the Y direction. Any observations falling within a validation point’s buffer zone are not used in the interpolation of that validation point. When these values are zero, all points in the validation limits are used.
Cross Validation Report
Click Report to generate a cross validation report.
Cross Validation Results File
Click Save to save a cross validation results file. The results are presented in an ASCII data file, which can be used as a gridding data file. The first line in the file contains column titles. Each subsequent line is associated with a validation point. There are seven numeric values per line. The first three values are the X, Y, and Z values from the original data file of each validation point. The fourth column, titled ID is the line number from the original data file of the validation point. The next two columns are the estimated and residual values. The nData column contains the total number of original data points.
Statistics Note
Under most interesting statistical models, the cross validation errors are not statistically independent: the estimate at one observation location uses much of the same information as the estimate at a neighboring observation location. As such, standard hypothesis testing and test of statistical significance are not valid. A discussion of this point can be found in the cross validation reference, Kitanidis (1997).
Cross Validation References
The following references include extensive discussion of the theory and application of cross validation. Isaaks and Srivastava [1989], Kitanidis [1997], Olea [1999], and Chiles and Delfiner [1999] focus on cross validation with kriging, but the general discussion applies to all of the supported gridding methods inSurfer.
Chiles, J. P. and P. Delfiner. (1999)Geostatistics: Modeling Spatial Uncertainty. John Wiley and Sons, New York, 695 pp.
Isaaks, E. H. and R. M. Srivastava. (1989) Applied Geostatistics. Oxford University Press, Inc., New York, 561 pp.
Kitanidis, P. K. (1997)Introduction to Geostatistics: Applications inCambridge University Press, Cambridge, 249 pp.
Olea, R. (1999) Geostatistics for Engineers and Earth Scientists. Kluwer Academic Publishers, Boston, 303 pp.
What's Next?
Click Next or Skip to End to proceed to the Output page. Click Finish to create the grid file.