Reports
Surfer can generate several types of detailed grid reports. This table provides a snapshot of the types of information produced for each report type. Descriptions of the report sections are below the table.
If you make changes to the data selection (i.e. changing a data column or changing the data filtering method) generate a new report by repeating one of the processes listed with the report type.
|
Information Produced |
Report Types and How to Access Them |
|||||
|
|
Cross Validation Report | Data Statistics Report | Grid Contour Vol/Area Report | Gridding Report | Grid Information Report | Variogram Data Report |
| Click Report in the Cross Validation dialog | Click the Statistics button in the Grid Data dialog | Click the Grids | Calculate | Contour Vol/Area command | Check the Grid Report Option on the Grid Data dialog | Click the Grids | Info | Grid Info command; or click Options | Grid Info in the Grid Editor | In the Variogram Properties click the Display Statistics button on the Statistics page and then click Report | |
|
Data Counts, includes Filtered and at Validation Points |
X | X | X | X | ||
|
Filtering, includes Breakline, Duplicate, Exclusion |
X | X | ||||
|
Grid Information, includes Grid Geometry |
X | X | ||||
|
Gridding Rules |
X | X | ||||
|
Inter-Variable Correlation, Rank Correlation and Covariance |
X | X | X | X | ||
|
Output Grid |
X | |||||
|
Principal Component Analysis |
|
X |
|
X |
|
|
|
Polygon Used for Statistics |
|
|
|
|
X |
|
|
Regression, includes Planar: Z=AX+BY+C and Residual: R=AX+BY +C |
X |
X |
|
|
|
X |
|
Statistics, such as Univariate, Nearest Neighbor, and Cross-Validation |
X |
X |
|
X |
X |
X |
|
Variogram Grid |
|
|
|
|
|
X |
|
Volume and Area |
|
|
X |
|
|
|
|
Z Transform, includes Grid and Data |
|
|
|
X |
|
|
Information Contained in Each Report Section
Each section of the report contains information about the grid, data, or variogram.
Time Stamp
|
Time of report |
Date and time the report was created in Mon Oct 14 10:43:13 2013 format |
|
Elapsed time to create grid |
Seconds required when gridding. Only included in the Gridding Report. |
Data Source
|
Source Data File Name |
path and file name of the data used in gridding |
|
X Column |
X data column |
|
Y Column |
Y data column |
|
Z Column |
Z data column |
|
Detrending |
variogram data detrending method selected on the General page in the New Variogram dialog. Only included in the Variogram Grid Report. |
Data Counts and Filtered Data Counts
Data Counts at Validation Points
The Data Counts at Validation Points section is only included in the Cross Validation Report.
|
Active Results |
locations at which the cross validation interpolation was successfully carried out |
|
NoData Results |
The NoData results are the locations at which cross validation interpolation was attempted, but was not successful. For example, the natural neighbor gridding algorithm can only interpolate at locations within the convex hull of the active data. As such, an observation that lies on the convex hull of the original, complete, data set will lie outside of the convex hull of the active data when that observation is the cross validation point. Cross validation is not possible using the natural neighbor algorithm at such a point, so it is assigned the NoData value. |
|
Attempted Results |
reports the number of locations at which cross validation interpolation was attempted |
|
Requested Results |
contains the original number of random data |
Z Data Transform
Includes the transformation method (if any) applied to the Z values. Lists the data that was unable to be transformed in a table.
The rest of the report information is calculated using the active data, including any artificial data generated by duplicate filtering. Excluded, deleted, or superseded data are not included in the following calculations.
Exclusion Filtering
|
Exclusion Filter String |
shows the Data Exclusion Filterstring |
|
Excluded Data |
number of data excluded by the Data Exclusion Filter - |
|
Excluded Data Table |
the excluded data are listed in a table. The ID is equal to the line number in the original data file. This list is 100 data rows long by default. |
Duplicate Filtering
|
Duplicate Points to Keep |
To Keep filter used |
|
X Duplicate Tolerance |
maximum X spacing of points to be considered a duplicate |
|
Y Duplicate Tolerance |
maximum Y spacing of points to be considered a duplicate |
|
Deleted Duplicates |
number of duplicates deleted by the Duplicate Data filter - the deleted duplicates are listed in the Duplicate Filtering section |
|
Retained Duplicates |
number of duplicates retained by the Duplicate Data filter (this statistic is not computed if the duplicate rule is ALL) - the retained duplicates are listed in the Duplicate Filtering section including any artificial data |
|
Artificial Data |
number of artificial data created by the Sum, Average, and Midrange Duplicate Data filters |
|
Duplicate Data Table |
the duplicate data table lists all of the duplicate points with X, Y, Z, ID, and Status. The ID is equal to the line number in the original data file. When the status is artificial, no ID is given since this data does not come from the original data file. The Status (Retained, Deleted, or Artificial) reports how the duplicate was handled. This list is 100 data rows long by default. |
Breakline Filtering
When breaklines are used, data that is within the X Tolerance and Y Tolerance, as set in the Filter dialog, of the breakline are deleted due to breakline data superseding original data.
|
Anisotropy Angle |
the anisotropy angle reported for the default variogram |
|
Anisotropy Ratio |
the anisotropy ratio reported for the default variogram |
|
X Tolerance |
maximum X spacing of points to be considered a duplicate |
|
Y Tolerance |
maximum Y spacing of points to be considered a duplicate |
|
Superseded Data |
Superseded data are number of data eliminated by breaklines in the Data Statistics Report and the Gridding Report. Breakline data always supersede point data. If point data are on, or in the immediate vicinity of, breakline data the point data are eliminated. |
|
Breakline Data Table |
the breakline data table lists all of the superseded data points with X, Y, Z, ID, and Status. The ID is equal to the line number in the original data file. The Status (Retained, Deleted, or Artificial) reports how the duplicate was handled. This list is 100 data rows long by default. |
Inter-Variable Correlation
The Inter-Variable Correlation table shows the correlation between the X, Y, and Z variables. The Cross Validation Report also contains Estimated Z and Residual Z columns and rows. The correlations are computed with
|
|
The correlation is positive when both variables increase or decrease together. The correlation is negative when one variable increases while the other variable decreases. A correlation of zero shows that there is no linear relationship between the variables.
Inter-Variable Covariance
The Inter-Variance Covariance table shows the covariance between the X, Y, and Z variables. The covariances are computed with
|
|
The covariance is positive if, on average, the variables are both above the mean. The covariance is negative if one variable is above the mean and the other variable is below the mean.
Inter-Variable Rank Correlation
The Inter-Variance Rank Correlation table shows the rank correlation between the X, Y, and Z variables. The data is ordered and then assigned a rank value from 1 to the count of values. Rank values range from -1 to +1. The correlation is positive when both variables increase or decrease together. The correlation is negative when one variable increases while the other variable decreases. A correlation of zero shows that there is no linear relationship between the variables.
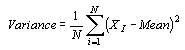
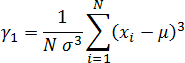
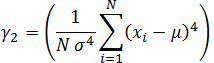
Univariate Statistics
This group of statistics shows information for X, Y, and Z data. These statistics do not include breakline data.
Planar Regression
Planar regression is an ordinary least-squares fit where Z=AX+BY+C.
-
The Parameter Values are the A, B, and C values.
-
The Standard Error is the estimated standard deviation of the parameters.
-
The Inter-Parameter Correlations are the correlation between A, B, and C coefficients.
-
The ANOVA Table shows regression statistics on the planar fit where df are the degrees of freedom and F is the ratio of the mean squares.
-
The Coefficient of Multiple Determination (R2) is calculated with
|
|
For the Cross Validation Report, the planar regression is the residual regression at the validation points.
Nearest Neighbor Statistics
The nearest neighbor statistics represent aspects of the data values and of the data locations. The nearest neighbor to a data point uses a simple separation distance without taking anisotropy into account. If two or more points tie as the nearest neighbor, the tied data points are sorted on X, then Y, then Z, and then ID. The smallest value is selected as the nearest neighbor.
The Separation column shows the separation distances between the observation and its nearest neighbor. The |Delta Z| column shows the absolute values of the differences between the observation Z value and the nearest neighbor Z value.
The statistics are the same as the Univariate Statistics (see above).
The Nearest Neighbor Statistics also includes the Complete Spatial Randomness section. The Complete Spatial Randomness statistics measure how random locations are in space. Surfer does not correct for edge effects so the statistics may be biased.
|
Lamda |
is the average spatial density
|
|
Clark and Evans |
where
Si= separation distance between the observation and the nearest neighbor The distribution of this statistic is normal, with a mean equal to one and a variance of See Clark and Evans (1954) and Cressie (1991) for more information. |
|
Skellam |
where
Si= separation distance between the observation and the nearest neighbor The distribution is Chi-Squared with 2N degrees of freedom. See Skellam (1952) and Cressie (1991) for more information. |
Principal Component Analysis
Principal component analysis (PCA) is a mathematical procedure that uses orthogonal transformation to convert a set of observations of possibly correlated variables into a set of values of linearly uncorrelated variables called principal components. The number of principal components is less than or equal to the number of original variables. The principal components are calculated for the X, Y, and Z values. A ![]() value is also reported for each principal component.
value is also reported for each principal component.
Variogram Grid
|
Max Lag Distance set on the General page in the New Variogram dialog |
|
|
number of Angular Divisions set on the General page in the New Variogram dialog |
|
|
number of Radial Divisions set on the General page in the New Variogram dialog |
Output Grid
|
Grid File Name |
name of the output grid file |
|
Grid Size |
number of rows and columns in the grid |
|
Total Nodes |
number of columns times the number of rows |
|
Filled Nodes |
number of grid nodes containing interpolated values |
|
NoData Nodes |
number of grid nodes containing the NoData value |
|
NoData Value |
reports the Z value associated with NoData nodes |
|
X Minimum |
minimum X grid line value specified in the Output Grid Geometry group in the Grid Data dialog |
|
X Maximum |
maximum X grid line value specified in the Output Grid Geometry group in the Grid Data dialog |
|
X Spacing |
X spacing set in the Grid Data dialog |
|
Y Minimum |
Minimum Y grid line value specified in the Output Grid Geometry group in the Grid Data dialog |
|
Y Maximum |
Maximum Y grid line value specified in the Output Grid Geometry group in the Grid Data dialog |
|
Y Spacing |
Y spacing set in the Grid Data dialog |
Grid Information
|
Grid File Name |
name of the output grid file |
|
Grid Size |
number of rows and columns in the grid |
|
Total Nodes |
number of columns times the number of rows |
|
Filled Nodes |
number of grid nodes containing interpolated values |
|
NoData Nodes |
number of grid nodes containing the NoData value |
|
NoData Value |
reports the Z value associated with NoData nodes |
Grid Geometry
|
X Minimum |
minimum X grid line value specified in the Output Grid Geometry group in the Grid Data dialog |
|
X Maximum |
maximum X grid line value specified in the Output Grid Geometry group in the Grid Data dialog |
|
X Spacing |
X spacing set in the Grid Data dialog |
|
Y Minimum |
Minimum Y grid line value specified in the Output Grid Geometry group in the Grid Data dialog |
|
Y Maximum |
Maximum Y grid line value specified in the Output Grid Geometry group in the Grid Data dialog |
|
Y Spacing |
Y spacing set in the Grid Data dialog |
Polygon used for statistics
|
Side |
Whether statistics were calculated for values Inside or Outside the polygon(s) |
|
Polygons |
Number of polygons used for calculating statistics |
|
Number of points |
Total number of vertices among the polygon(s) |
Gridding Rules
This section displays the gridding method used, as well as the option settings for each gridding method.
Univariate Grid Statistics
The Univariate Grid Statistics are the same as those reported in the Univariate Statistics and Nearest Neighbor Statistics sections.
Univariate Cross-Validation Statistics
The Univariate Cross Validation Statistics section are the same as those reported in the Univariate Statistics. It also contains an additional column of data, called Data Used. This column shows the number of data points used in the calculation.
Volumes and Areas
Volume and area calculations are based on the Simple level method for contour line properties. Minimum and maximum contours along with the contour interval must be specified. Surface area and planar area calculations are made above, below, and between contours. Contour volume calculations are made above, below, and between contours.