Grid Contour Vol/Area Report
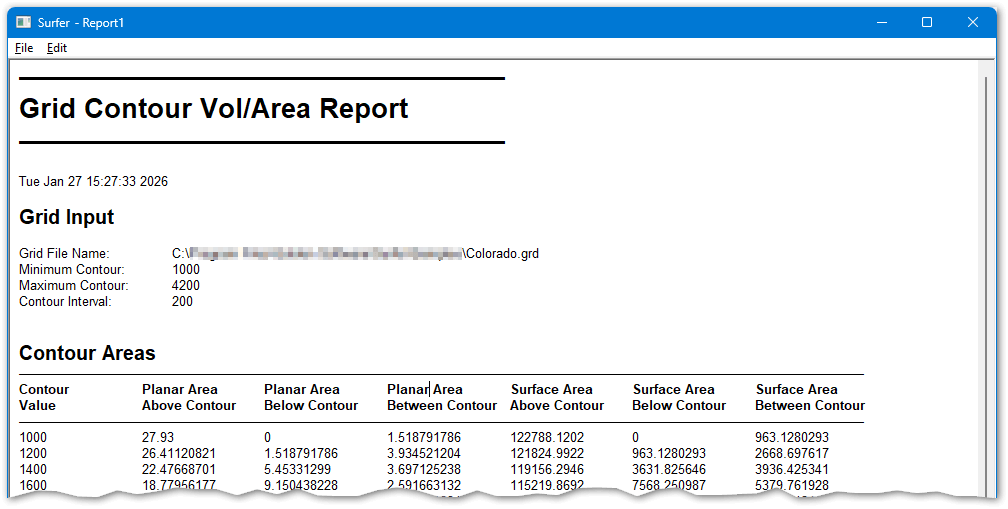
Click OK in the Contour Volume and Area dialog box to open the operational metrics within the standalone Grid Contour Vol/Area Report document manager. Use File | Save As to export the report text, or copy the formatted fields onto your clipboard to paste data into external applications.
The document separates calculations into distinct geographic footprints, reporting both planar and surface areas relative to your contour steps:
|
| Grid Contour Vol/Area Report window interface overview. |
Planar Area vs. Surface Area Geometry
-
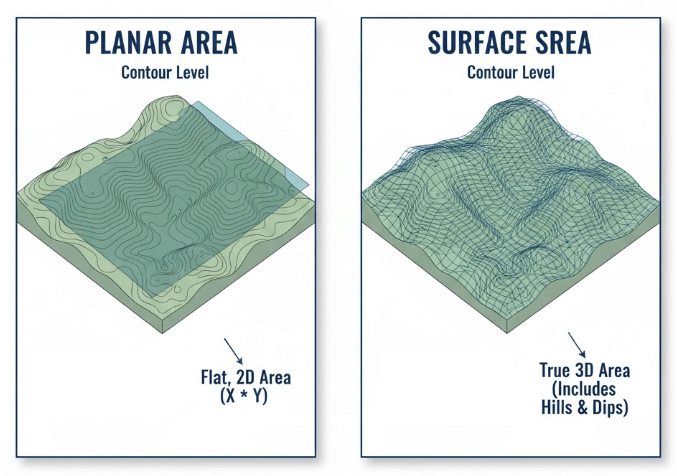
Planar Area: Represents the completely flat, two-dimensional horizontal projection footprint calculated as plain ΔX * ΔY dimensions, completely independent of terrain change.
-
Surface Area: Computes the true three-dimensional area, actively incorporating the vertical "hills and dips" of the terrain slope. Due to geometric adjustments for pitch along the vertical axis, the Surface Area metric will always be mathematically larger than or equal to its matching Planar Area footprint.
|
| Planar area vs surface area structural calculation example diagram. |
Report Calculation Definitions
Each area and volume increment is quantified relative to a explicit Z-level target (Contour Value):
|
Report Column |
Description |
Example Image |
|---|---|---|
|
Above Contour |
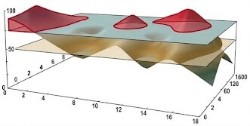
Integrates everything starting from the specified contour line value up to the absolute highest coordinate node detected in the grid file. |
|
|
Below Contour |
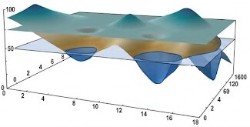
Integrates everything starting from the specified contour line value down to the absolute lowest coordinate node detected in the grid file. |
|
|
Between Contour |
Quantifies the specific horizontal area or vertical volume isolated between the current contour step line and the subsequent line in the interval (e.g., tracking the exact structural horizontal slice captured between the 1400 and 1600 lines). |
|
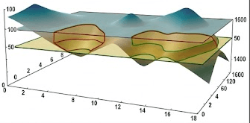
Golden Nugget : You can reproduce and audit the exact volumetric results found in this document using the standard Grid Volume engine:
• To replicate Above Contour values, set your grid file as the Upper Surface boundaries and input your target contour value as a Constant Z for the Lower Surface.
• To replicate Below Contour values, invert the parameters by configuring the target contour value as a Constant Z for the Upper Surface and setting your grid file as the Lower Surface boundary.
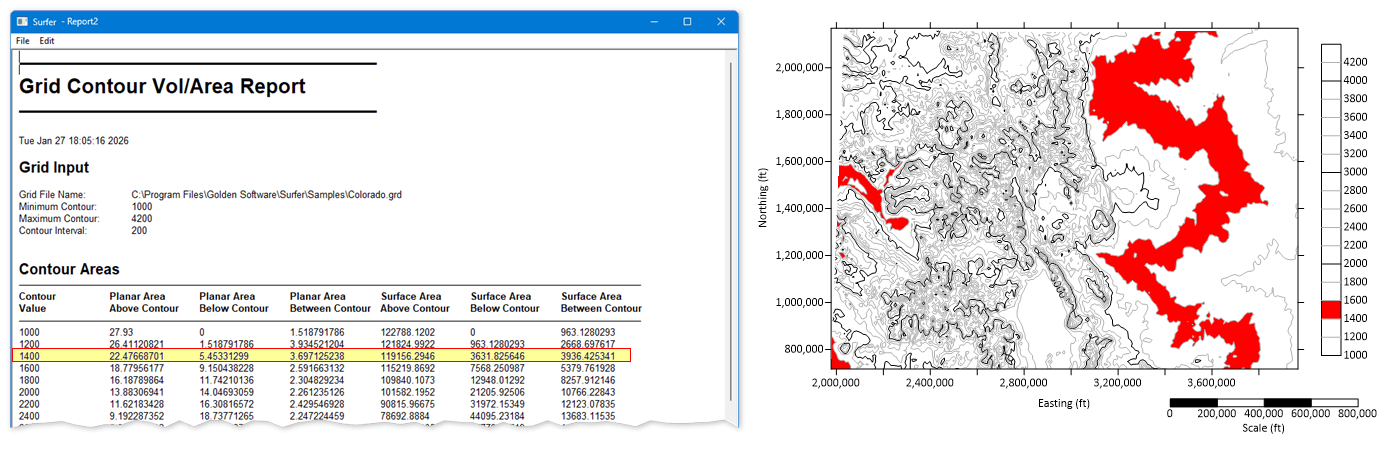
|
| Grid Contour Vol/Area Report and contour map highlighting matching tracking zones. |
See Also
Introduction to Volumes, Areas, Cross Sections