Grid Function
The Grids | New Grid | Function command creates a grid file from a user-defined two variable equation of the form Z = f(X,Y). The density of the generated grid is a function of the Minimum, Maximum, and Increment values for both X and Y. The Grids | New Grid | Function command can use any of the mathematical functions. Grids created as functions can be plotted in the same way as grids created using the Grid Data command.
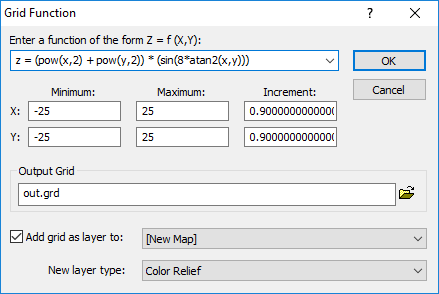
Grid Function Dialog
Click the Grids | New Grid | Function command or the  button to open the Grid Function dialog.
|
|
|
Set the mathematical function, the minimum and maximum X and Y values, and the function increment values in the Grid Function dialog. |
Enter a Function
Enter the function of interest into the Enter a function of the form Z = f (X,Y) box. The function calculation is repeated for each Z value to be written to the grid file. The number of grid nodes in the output grid and, therefore, the number of calculations to be performed, is based on the Minimum, Maximum and Increment values specified.
To use a stored function, click the ![]() next to the current function. This will display the ten most recent functions used. The functions are stored in the registry, so the equations are stored between Surfer sessions. You can also start typing the function in the function box. If the function is in the ten function history, the entire function will auto-complete.
next to the current function. This will display the ten most recent functions used. The functions are stored in the registry, so the equations are stored between Surfer sessions. You can also start typing the function in the function box. If the function is in the ten function history, the entire function will auto-complete.
Minimum X and Y
In the Minimum X and Y boxes, specify the beginning values used in the specified function. The first grid node, defined by these boxes, is calculated based on these values. These values also specify the lower X and Y limits in the grid file.
Maximum X and Y
In the Maximum X and Y boxes, specify upper values to be applied to the function and the upper X and Y limits for the grid.
Increment X and Y
In the Increment boxes, specify the amount to step in the X and Y directions for each grid line. This is similar to the grid Spacing setting in the Grid Data dialog.
Output Grid
Type a file path and file name, including the file type extension, in the Output Grid field, or click the ![]() button and specify the path and file name for the grid file in the Save Grid As dialog.
button and specify the path and file name for the grid file in the Save Grid As dialog.
Add New Map or Layer
Check the Add grid as layer to check box to automatically add the created grid to a new or existing map. Select [New Map] in the Add grid as layer to field to create a new map. Click the current selection and select an existing map to add a new layer to the map. Select the layer type by clicking the current selection in the New layer type field and selecting the desired layer type from the list.
Note: If you are saving the grid file in the DEM grid format, clear the Add grid as layer check box and add the map or layer with a Home | New Map or Home | Add to Map | Layer command.