Isopach Map
The Grids | Calculate | Isopach command can be used to generate an isopach or isochore grid and map to show thickness between two surfaces. An isopach map is also referred to as a True Stratigraphic Thickness (TST) map. This type of map represents the true thickness of a stratigraphic unit. An isochore map, also known as a True Vertical Thickness (TVT) map, shows the vertical thickness of a unit, which is the thickness from the upper surface straight down to the lower surface. If the unit was horizontal, this would be the same as TST, but if units have a dip or incline, the vertical thickness is different from the stratigraphic thickness. The following image illustrates this difference:
|
|
|
Isopach and isochore thickness measurement example. |
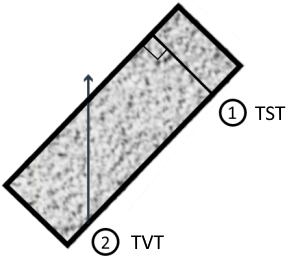
- Isopach (TST) measures the actual thickness between two surfaces.
- Isochore (TVT) measures from a point on the upper surface to a point on the lower surface, which may not be the actual thickness. This is what the Grids | Calculate | Math command calculates when you subtract one grid file from another.
Note: Before creating an isopach map, make sure the XY and Z data in your grid file are the same unit of measure (e.g. meters, feet, etc...). If they are not the same units, then you must convert or project them to the same units. Isochore maps can be created from data in different units.
To convert or project a grid file to the same units for isopach maps:
- If the grid data is based on longitude and latitude, use the Grids | Edit | Project command to project the grid in a coordinate system in units that match the Z units. For example, if the Z units are meters, an appropriate coordinate system could be one of the UTM systems.
- If the map uses different linear units for XY, and Z (e.g. X and Y are in feet and Z is in meters), use the Grids | Calculate | Math command to convert the Z units to match the X and Y units, or use the Grids | Calculate | Project command to convert the X and Y units to match the Z units.
Follow these steps to create an isopach or isochore map, for example to generate a contour map representing the thickness of a coal seam using drillhole data that provides the elevation of the upper surface and lower surface of the coal seam.
- Create grid files of the upper and lower surfaces (for example, grid files that define the elevation of the top and bottom of a coal seam). Both grids must use the same XY ranges and have the same number of rows and columns.
- Select the Grids | Calculate | Isopach command.
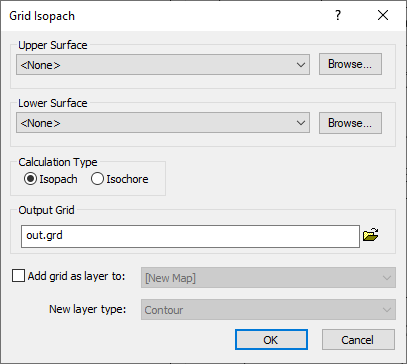
Grid Isopach dialog
- In the Grid Isopach dialog, click the Browse button next to Upper Surface. In the Open Grid dialog, select the grid file for the upper surface and click Open or click the Download button to download a grid file.
- Click the Browse button next to Lower Surface. In the Open Grid dialog, select the grid file for the lower surface and click Open or click the Download button to download a grid file.
- Based on the type of map that you want, click Isopach or Isochore from the Calculation Type section.
- Click the
 button in the Output Grid section, enter the name for the thickness grid file in the Save Grid As dialog, and click Save.
 - Check the Add grid as layer to check box to display the grid or leave unchecked to just create the grid file listed in Output Grid.
- Select the layer type for the new grid from the New layer type list.
- Click OK to generate the selected grid.