Nonlinear Filters
The Nonlinear Filters are not weighted averages of the neighboring input grid values; however, they are simple functions of the neighboring input grid values.
Order Statistics Filters
|
Minimum (mxn) |
The output grid node value equals the minimum of the neighboring values. |
|
Lower Quartile (mxn) |
The output grid node value equals the twenty-five percentile of the neighboring values. |
|
Median (mxn) |
The output grid node value equals the fifty percentile of the neighboring values. |
|
Upper Quartile (mxn) |
The output grid node value equals the seventy-five percentile of the neighboring values. |
|
Maximum (mxn) |
The output grid node value equals the maximum of the neighboring values. |
|
Range (mxn) |
The output grid node value equals the maximum minus the minimum of the neighboring values. |
Moment Statistics Filters
|
Standard Deviation (mxn) |
The output grid node value equals the standard deviation of the neighboring values. The standard deviation is the square root of the variance. |
|
Variance (mxn) |
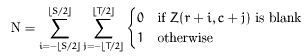
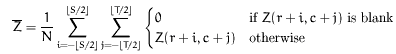
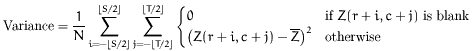
The output grid node value equals the variance of the neighboring values. The computation involves three steps. First, count the number of non-NoData (i.e. non-blank) input grid node values in the neighborhood. With a neighborhood height S and width T, compute
Second calculate the local average,
Third, compute the local variance as
|
|
Coef. of Variation (mxn) |
The output grid node value equals the coefficient of variation of the neighboring values. The coefficient of variation is the standard deviation divided by the average.
If the average (the denominator) is too small, then the coefficient of variation is arbitrarily set equal to 0. |
Other Nonlinear Filters
|
Median Difference (mxn) |
For each output grid node, (r, c), identify the set of non-NoData (non-blank), neighboring input grid node values. Compute the median of these neighboring values. Let B represent this median value. Then the output grid node value is set equal to
The effect of this filter is to emphasize outliers in the grid. |
|
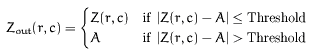
Threshold Averaging (mxn) |
For each output grid node, (r, c), identify the set of non-NoData (non-blank), neighboring input grid node values. Compute the average of these neighboring values, excluding the value of the corresponding input grid node. Let A represent this average value. Then the output grid node value is set equal to
where Threshold is the specified value. The effect of this filter is to eliminate outliers in the grid. |
Compass Gradient Filters
Compass gradient filters find edges in the eight different compass orientations (east, northeast, north, northwest, west, southwest, south, and southeast). First, eight different linear convolution filters designed to detect edges in each of the eight directions is applied. The output grid node value is the maximum absolute value resulting from these eight convolutions. The Prewitt (3X3), Kirsch (3X3), Robinson 3-level (3X3), and Robinson 5-level (3X3) are four of the more common edge detection convolution filters in the literature. For details see Crane (1997, p.88-90).