Changing Map Properties
The look of your final map impacts the quality of your presentations and therefore how well the story of your data is understood by your audience. There are two primary ways to change how the map looks in Surfer: by changing the source data or by changing the properties.
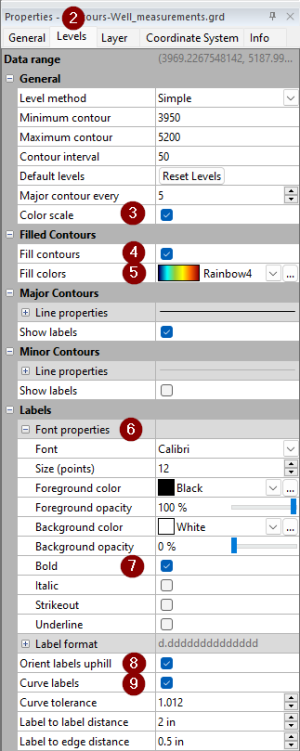
In this lesson, we will focus on customizing the contour map properties.
These settings are just one combination of the infinite options available to you!
If you desire more control over your contour customizations, you can define specific contour layers and customize them individually with the Advanced level method. |
|
Most of the properties used to impact the look and feel of a map will belong to individual map layers like the contour layer above. However, one key map feature is best added via the axis properties: the map title! You could also simply insert text but using the axis properties ensures the title is always centered over the map.
To add a title to your map:
-
Click the Top Axis in the Contents window to select it.
-
Click the General tab in the Properties window.
-
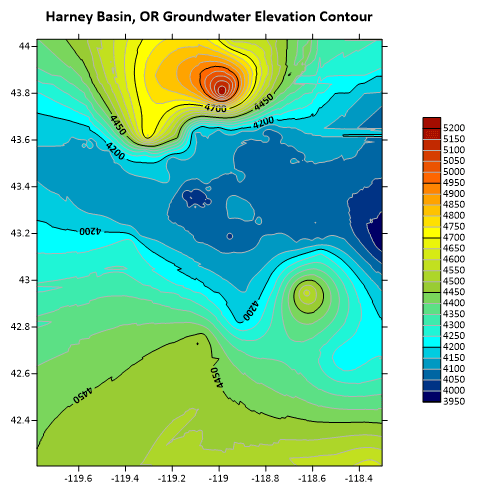
In the Title text field, enter Harney Basin, OR Groundwater Elevation Contour and press ENTER.
-
Click the + next to Font properties to expand the section.
-
Click the up/down arrows to change the Size (points) to 16
-
Check the box next to Bold.
After completing the steps above your contour map will look like the below map.
|
We have completed the basic process of gridding data, creating a map and adjusting the contour properties. Next we'll add context to further explain the data being illustrated by the map.
Back to Gridding
Next to Adding Context Layers