Gridding Data
Typically, data files contain randomly spaced points and the data must be converted to an evenly spaced grid, also known as a raster, to create a map. In Surfer, the process of converting randomly spaced data into an evenly spaced grid is called gridding. You might also hear it referred to as data interpolation. Surfer is well-known throughout the industry for its powerful and accurate gridding algorithms.
Once you have an evenly spaced grid, it can then be used to generate a contour map or any other grid-based map like color relief, peaks and depressions, watershed, or 3D surface.
In this lesson we will outline the process of creating a grid and contour map from the ground water elevation dataset.
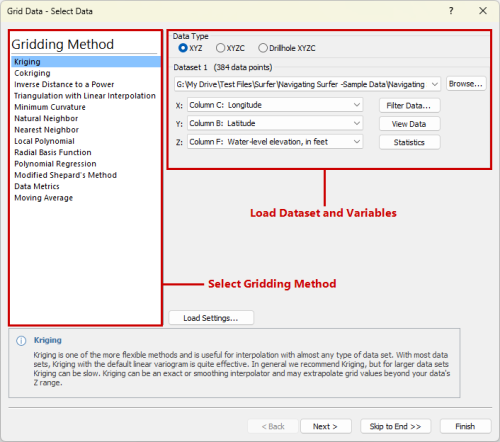
Data for gridding can have X & Y coordinates in any coordinate system. The Z value can represent anything associated with those coordinates like chemical concentrations, electrical resistivity, or elevation. In this example we are using an XYZ dataset with lat/lon XY coordinates, and water-level elevation (Z) data in feet.
-
Click the Plot1 tab just below the ribbon leaving the Worksheet tab open.
Reminder: A Plot document is required to create a map because it houses all objects included in a project.
-
Click the Home | Grid Data | Grid Data (
 ) command.
|
|
After you click Skip to End you will be taken to the final page of the Grid Data dialog, the Output section. Here you can alter the geometry of your final grid, set the location to save your grid file, and choose to add the grid as a specific map layer.
To finish the gridding process and generate a new contour map: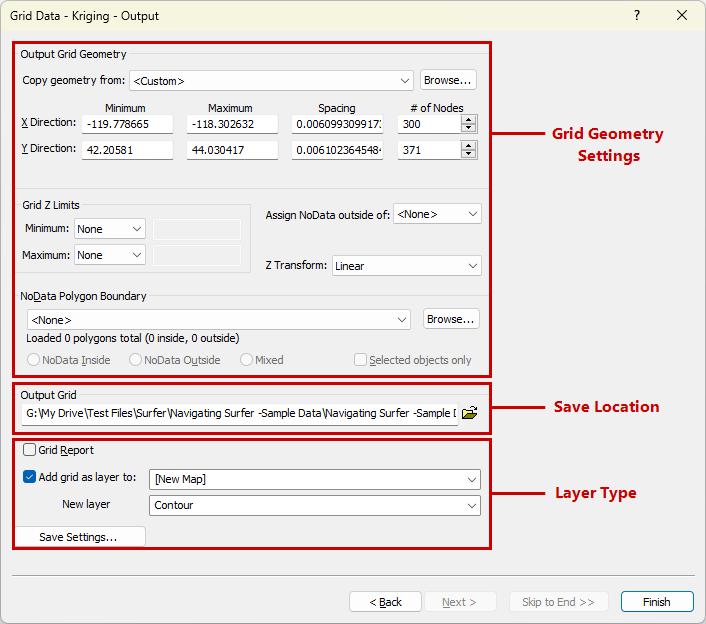
-
Click in the # of Nodes field for the X Direction and enter 300.
-
Click in the # of Nodes field for the Y Direction and enter 371.
The # of Nodes for a grid file is similar to the number of pixels in an image. A resolution of 300-500 nodes in both directions is a good quality for most datasets. A resolution of 600 or more in both directions is high resolution and will result in much larger files.
-
Click the folder icon next to Output Grid and set the location to save your grid file.
Most Windows user accounts cannot save new files to the Samples directory. If you do not choose a new location, an error will be displayed after clicking Finish.
-
Check the box next to Grid Report to generate a report with detailed statistics on the gridded dataset.
-
Check the box next to Add grid as layer to and select [New Map] from the drop down menu.
-
Select Contour in the New layer type field.
-
Click Finish.
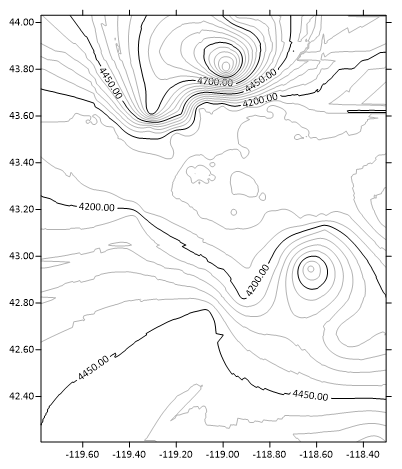
In a matter of seconds, Surfer transforms the irregularly spaced dataset into an evenly spaced grid, adds a new contour layer, saves the GRD file, and compiles the grid report.
-
Click OK in the Export Options dialog.
By default, Surfer will create a GS Reference (Version 2) file with the coordinate system information for the new grid file. If you plan to use the file in another program additional reference file types may be needed.
-
Click OK to close the Surfer dialog stating the grid file was created.
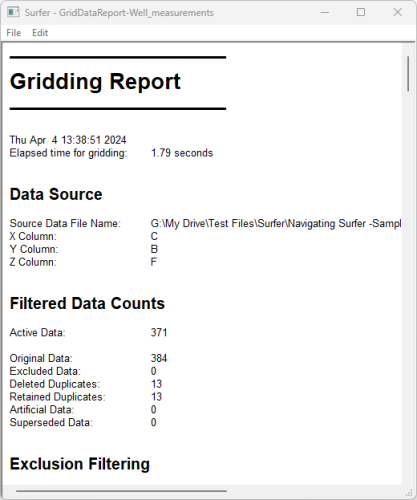
You should now have a contour layer of the site's groundwater elevation in the Plot Document window and a separate window containing the Gridding Report.
|
|
-
Click File | Close in the GridDataReport window.
We recommend saving this report for future reference in most cases but it is not needed today.
Before we proceed, save let's save our work!
-
Click File | Save or the Save icon (
 ) and save your file as a Surfer Plot (*.srf) file in your preferred file location.
A SRF file is Surfer's project file format. By saving as a SRF you can close and open your project at any point to resume editing as the SRF file includes all the associated data.
To prevent accidental loss of work in the future, we recommend turning on a few important settings. Your future self will thank you!
-
Click File | Options.
-
From the General section check these two boxes,
-
Backup files before saving. Sometimes data gets corrupted and cannot be recovered. This safeguard creates backup files you can roll back to should this ever happen.
-
Save auto recovery information. Surfer will save your work automatically and should Surfer ever closes unexpectedly, your project can be automatically restored.
-
It's time to elevate your contour map into a stunning visual that is guaranteed to leave an impression.
Let's customize these contours...
Back to Data Best Practices
Next to Changing Map Properties