Grid from Contours
Click the Grids | New Grid | Grid from Contours command or the  button to create a grid file from contour lines. The contour lines can be loaded as a base layer or the vector file containing the contour lines can be used to generate a grid file. The Grid from Contours command uses the contour line polyline, polygon, 3D polyline and 3D polygon vertices and height attribute (commonly ZLEVEL) to create a grid. The Grid from Contours command algorithm interpolates grid node values as a linear combination of the two nearest contour values. The Grid Contours dialog is opened when the Grids | New Grid | Grid from Contours command is clicked.
Grid Contours Dialog
The Grid Contours dialog contains the input vector file or layer, input fault file or layer, gridding options, and output grid file settings.
|
|
|
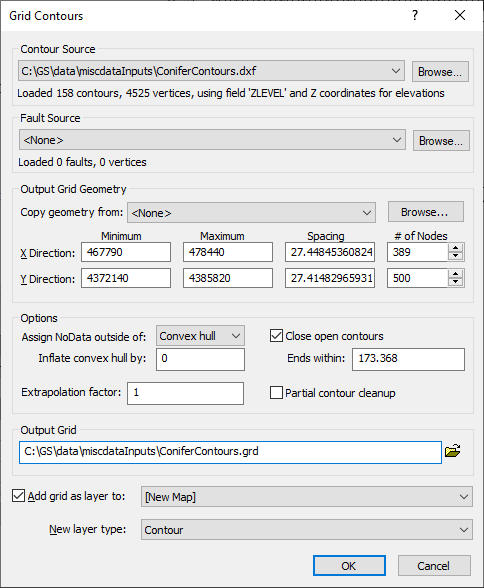
Create grid files from contour lines with the Grid Contours dialog. |
Contour Source
The Contour Source is the vector data file or base layer containing the contour lines from which to generate a grid. There are two methods for specifying the Contour Source:
- Select a map layer from the Contour Source list by clicking the current selection and then clicking the desired layer. Base layers are only included in the Contour Source list if the objects in the layer contain one or more numeric attribute fields.
- Specify a vector data file as the Contour Source by clicking Browse. The Open dialog is displayed. Navigate to the desired vector file and click Open. An Import Options dialog may be displayed depending on the vector file format.
Once a Contour Source is selected, the Select Field dialog is displayed. Specify which attribute field contains elevation information in the Select Field dialog. For 3D polylines and 3D polygons, select [None] and check Use Z coordinate for 3D geometry to use the Z coordinates rather than the attributes. If an attribute field and Use Z coordinate for 3D geometry are both selected, the Z coordinate will take precedence. To exclude all 2D objects, select [None].
The layer name or file path and name is displayed in the Contour Source field when a Contour Source has been loaded. The number of contours, number of vertices, and elevation field selection are displayed below the Contour Source.
Fault Source
The Fault Source is the vector data file or base layer containing any faults to include in the grid generation. Select a base layer from the Fault Source list by clicking the current selection and then clicking the desired layer. Specify a vector data file as the Fault Source by clicking Browse. The Open dialog is displayed. Navigate to the desired vector file and click Open. An Import Options dialog may be displayed depending on the vector file format.
The layer name or file path and name is displayed in the Fault Source field when a Fault Source has been loaded. The number of faults and number of vertices is displayed below the Fault Source.
Supported Formats
The following file formats are supported in the Contour Source and Fault Source fields:
E00 Esri ArcInfo Export Format
GSI Golden Software Interchange
MIF MapInfo Interchange Format
Output Grid Geometry
The Output Grid Geometry section defines the grid limits and grid density.
Copy Geometry
The Copy geometry from option copies the grid geometry from an existing map layer or grid file. This option is useful when creating grids that will become overlaid map layers, processed with the Grid Math command, or used to calculate a volume between two surfaces. The Math and Volume commands require the input grids to have the same geometry.
To copy the geometry from an existing layer, select the layer in the Copy geometry from list. To copy the geometry from a grid file, click Browse and select the file in the Open Grid dialog. Select <None> to return the Output Grid Geometry options to their default values and to manually edit the grid geometry.
Minimum and Maximum X and Y Coordinate (Grid Limits)
Grid limits are the minimum and maximum X and Y coordinates for the grid. Surfer computes the minimum and maximum X and Y values from the Contour Source layer or data file. These values are used as the default minimum and maximum coordinates for the grid.
Grid limits define the X and Y extent of contour maps, color relief maps, vector maps, 3D wireframes, and 3D surfaces created from grid files. When creating a grid file, you can set the grid limits to the X and Y extents you want to use for your map. Once a grid file is created, you cannot produce a grid-based map larger than the extent of the grid file. If you find you need larger grid limits, you must regrid the data. You can, however, read in a subset of the grid file to produce a map smaller than the extent of the grid file.
When either the X, Y, or Z value is in a date/time format, the date/time values are converted and stored in the grid as numbers.
Spacing and # of Nodes (Grid Density)
Grid density is usually defined by the number of columns and rows in the grid, and is a measure of the number of grid nodes in the grid. The # of Nodes in the X Direction is the number of grid columns, and the # of Nodes in the Y Direction is the number of grid rows. The direction (X Direction or Y Direction) that covers the greater extent (the greater number of data units) is assigned 500 grid nodes by default. The number of grid nodes in the other direction is computed so that the grid nodes Spacing in the two directions are as close to one another as possible.
By defining the grid limits and the number of rows and columns, the Spacing values are automatically determined as the distance in data units between adjacent rows and adjacent columns.
You can also increase or decrease the grid density by using the Grids | Edit | Spline Smooth, Grids | Resize | Extract, or Grids | Resize | Mosaic commands after a grid is created. See the Grid Data topic for information on memory requirements for large and/or dense grids and a grid geometry example.
Options
The Options section of the Grid Contours dialog contains options for assigning the NoData value outside the convex hull of the data or outside of the alpha value, control over extrapolation in peaks and basins, contour closing, and contour cleanup.
Assign NoData
Convex Hull
Select Convex hull from the Assign NoData outside of list to assign the NoData value to the grid nodes outside the convex hull of the data. The convex hull of a data set is the smallest convex polygon containing all the data. The convex hull can be thought of as a rubber band that encompasses all data points. The rubber band only touches the outside points. Areas inside the convex hull without data are still gridded. See the Grid Data topic for an example of assigning NoData outside the convex hull of the data.
If Convex hull is selected from the Assign NoData outside of list, the Grid Contours dialog displays the Inflate convex hull by box. Enter a value to expand or contract the convex hull. When set to zero, the boundary connects the outside data points exactly. When set to a positive value, the area assigned the NoData value is moved outside the convex hull boundary by the number of map units specified. When set to a negative value, the area assigned the NoData value is moved inside the convex hull boundary by the number of map units specified. Values are in horizontal (X) map units. If the value is set to a large positive value, the grid values may extend all the way to the minimum and maximum X and Y limits of the grid, essentially overriding the Assign NoData outside convex hull of data option. If the value is set to a large negative value, the entire grid may be assigned the NoData value, resulting in no grid file being created.
Alpha Shape
Select Alpha shape from the Assign NoData outside of list to assign the NoData value to the grid nodes outside the alpha value of the data. Select Alpha shape instead of Convex hull to have a tighter boundary, especially if a boundary could form concave areas. If Alpha shape is selected from the Assign NoData outside of list, the Grid Contours dialog displays the Alpha value box. Enter a value to define the radius of the circles that are created by the edges of the triangulation of the points. Larger alpha values create a more convex boundary and smaller alpha numbers create a tighter, concave boundary. If too low or too high of an alpha value was entered, a message will appear stating that the grid could not be assigned NoData because of the alpha value. For more information on alpha shapes or to determine an appropriate alpha value, see the Alpha Shape help topic.
Extrapolation Factor
The Extrapolation factor controls the rate of change in the Z for grid node values with only one bounding contour. These grid nodes are usually located near peaks and basins. The slope between the nearest two contour lines is multiplied by the Extrapolation factor to perform linear extrapolation. Type the desired factor in the Extrapolation factor field.
The Extrapolation factor must be greater than or equal to zero, and the default Extrapolation factor is one. An Extrapolation factor of zero generates a grid with flat peaks and basins. An Extrapolation factor less than one will lessen the rate of change in Z with distance from the nearest contour and generate lower peaks and shallower basins. An Extrapolation factor greater than one will increase the rate of change in Z with distance from the nearest contour and generate higher peaks and deeper basins.
Close Open Contours
Check the Close open contours check box to automatically close any contour lines with ends within the specified Ends within tolerance. Contours will not be closed if the added section intersects any existing contours. Contours will also not be closed if the ends are further apart than the Ends within distance.
The Close open contours option is enabled by default. This improves the algorithm performance near the edges of the map and for any open contours in the map interior. The default Ends within distance is 1% of the diagonal distance of the grid. Specify an Ends within distance in horizontal (X) map units by typing the value in the Ends within field.
Clear the Close open contours check box to generate the grid from the contour lines in the layer or vector file without closing open contours. The Ends within field is not available when Close open contours is not checked.
Partial Contour Cleanup
Check the Partial contour cleanup check box to improve performance around open contours that terminate in the interior of the map, especially near the edges of the map or when the contour lines indicate faulting. However for some input layers or files, the Partial contour cleanup option will decrease performance in the resulting grid. By default the Partial contour cleanup check box is not checked.
The Partial contour cleanup option changes the algorithm to ignore "invisible" contour lines when calculating grid node values. First, the algorithm determines the nearest contour levels. Next, the algorithm determines if any of the levels are blocked from view by nearer levels. If this is the case, the occluded contour levels are ignored and the algorithm treats the grid node value as a bounded point (see the Extrapolation factor section).
Output Grid
Choose a path and file name for the grid file in the Output Grid group. You can type a path and file name, or click the ![]() button to browse to a new path and enter a file name in the Save Grid As dialog.
button to browse to a new path and enter a file name in the Save Grid As dialog.
Add New Map or Layer
Check Add grid as layer to to add the created grid to a new or existing map. Select [New Map] in the Add grid as layer to field to create a new map. Click the current selection and select an existing map to add a new layer to the map. Select the layer type by clicking the current selection in the New layer type field and selecting the desired layer type from the list.
Notes: If you are saving the grid file in the DEM grid format, clear the Add grid as layer check box and add the map or layer with a Home | New Map or Home | Add to Map | Layer command. When exporting to a BLN or DXF file, the Z coordinates for 3D polylines are not exported.
Reference for Grid from Contours
See Koshel, S. M., Algorithm for Topologically Correct Gridding of Contour Data, Department of Cartography and Geoinformatics, Faculty of Geography, Lomonosov Moscow State University, for more information regarding the gridding algorithm.