3D Wireframe Layer Color Zones Properties
To edit a 3D wireframe, click once on the wireframe map to select it. The properties for the wireframe map are displayed in the Properties window.
|
|
|
Click on the Color Zones tab to edit the properties. |
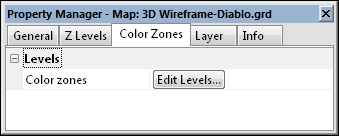
In the Properties window, click on the Color Zones tab. Then, click on the Edit Levels button to open the 3D wireframe Color Zones dialog. The Color Zones dialog controls the color to apply to lines of constant X, Y, and Z based on Z values in the grid file. For the Color Zones options to appear, the same box next to X, Y, or Z in the Plot Lines of Constant section on the General tab must also be checked.
|
|
|
Change the color zone properties in the Color Zones dialog. |
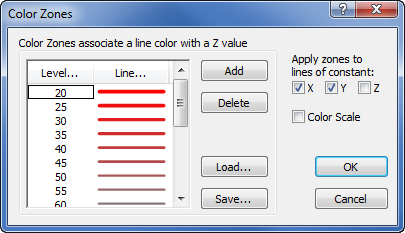
Level
Evenly spaced Z levels are assigned by clicking the Level button. This displays the Contour Levels dialog. Set the Minimum, Maximum, and Interval and click OK.
Level Value For One Level
To set a specific contour level, double-click the level value in the list that you wish to change. The Z Value dialog opens. Enter a new value, and click OK. This method creates unequal intervals between wireframe Z level lines.
Line
Click the Line button to open the Line Spectrum dialog and create gradational line color.
Level Line Property For One Level
To set a specific contour level line property, double-click the sample line next to the level value you wish to change. The Line Properties dialog opens. Make changes to the line properties and click OK. Line Style, Color, Opacity, and Width can be altered. 3D wireframes do not support complex line styles.
Add
Click the Add button to add a level. The added level is placed between the currently selected level and the level above the currently selected level with a value that is halfway between the two level values.
Delete
Highlight a level and then click the Delete button to remove a level.
Load
Click the Load button to load a level file. Level files can be created manually, or with wireframe or contour maps. When the level file contains additional options, like labels and hachures, the selected level line properties affect the Z contours on the 3D wireframe and do not display contour labels or hachures.
Save
Click the Save button to save a level file.
Apply Zones to Lines of Constant X, Y, and Z
The Apply zones to lines of constant allows the selection of which type of lines you want the color zones applied. Check the boxes next to X, Y, and Z to apply the colors to lines of constant X, Y, or Z.
Note that the same boxes must be checked on the General tab in the Plot Lines of Constant section for the color zone changes to appear on the map.
Color Scale Bar
A color scale bar can be displayed on the map by checking the box next to the Color Scale option on this page.
Editing Color Zones
- Click once on the wireframe to select it.
- In the Properties window, click on the General tab.
- In the Plot Lines of Constant section, check the box next to X, Y, or Z . The box must be checked on this tab for the color zone line properties to have an affect.
- In the Properties window, click on the Color Zones tab.
- Click the Edit Levels button next to Color zones.
- In the Color Zones dialog, change the desired line and level properties.
- Check the X, Y, or Z boxes to apply the color zone to that type of constant line.
- Click OK and the wireframe is updated.