3D View Axis Ticks Properties
The Ticks page for the 3D view axis objects includes options for axis tick and grid line spacing and appearance. The Ticks page properties can be reset to default values on the Scaling page.
|
|
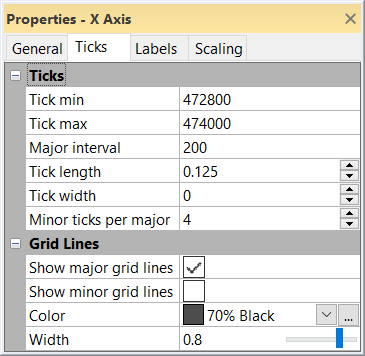
Set the tick and grid line properties in the Ticks page. |
Ticks
Set the tick size and spacing options in the Ticks section.
Tick Min and Tick Max
Specify the range over which tick mark and grid lines are displayed in the Tick min and Tick max property fields. Set the Tick min and Tick max values to the desired value in map units.
Perpendicular grid lines are drawn to the Tick max for an axis. For example, the Tick max property for an X axis controls which grid lines are drawn for the X axis and the grid line length for the Y axis and Z axis grid lines.
Major Interval and Minor Ticks Per Major
Specify the tick spacing in the Major interval field. Major ticks and major grid lines are drawn at the Tick min and then at every Major interval between the Tick min and Tick max. Minor tick marks and minor grid lines are controlled by the Minor ticks per major property. Specify the number of minor ticks and minor grid lines between the major ticks in the Minor ticks per major field. For example, with a Major interval of 50 units, a Minor ticks per major value of 4 places minor tick marks at 10, 20, 30, and 40 unit increments between the major ticks.
Tick Length
The Tick length property sets the length of the major tick marks. Set the Tick length to a value between 0 and 1. Set the Tick length to 0 to hide the tick marks. The minor tick mark length automatically adjusts to half the major tick mark length
Tick Width
The Tick width property sets the width of the tick marks. Set the Tick width to a value between 0 and 1. Both major and minor tick marks are controlled by the Tick width property.
Grid Lines
The Grid lines section includes the appearance properties for the grid lines.
Show Major Grid Lines and Show Minor Grid Lines
Select the Show major grid lines property to display grid lines at the major tick marks. Select the Show minor grid lines property to display grid lines at the minor tick marks. Clear the check boxes to remove the grid lines.
Color
Select the axis color in the Color field. Select a color from the color palette or click  to set a custom color in the Colors dialog.
Width
The Width property sets the grid line width. Set the Width property to a value between 0 and 1.
See Also
3D View Axis General Properties