Contours - Grid Editor
The Contours object in the grid editor Contents window contains the grid editor contour level and line properties. Click the Contours object to change the contour properties in the Properties window. Click the Info property page to view information about the grid file.
The visibility check box next to the Contours object is used to turn on or off the contour lines in the grid editor window. When the check box is checked, contour lines are displayed on the grid in the grid editor. When the command is not checked, the contour lines are not displayed.
|
|
|
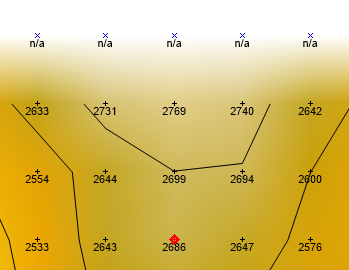
This image displays grid node symbols, labels, contour lines, and a color fill for a grid file. |
Info Properties
An Info page is displayed in the Properties window when the Contours object is selected. See the Grid Info Properties help topic for more information on these common, information only, properties.
Grid Contour Properties
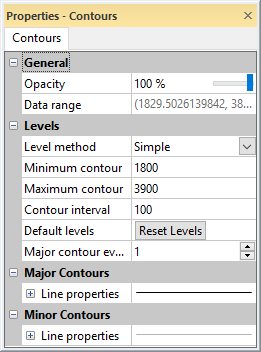
The Contours page is displayed in the Properties window when the Contours object is selected. Edit the contour opacity, level method and properties, and line properties in the Properties window.
|
|
|
Edit contour properties in the Properties window. |
Opacity
Change the Opacity of the labels by entering a value from 0% (completely transparent) to 100% (completely opaque). To change the opacity, highlight the existing value and type a new value. Press ENTER on the keyboard to make the change. Or, click and drag the  to change the opacity percentage.
Data Range
The Data range displays the Z minimum and maximum values read from the grid file.
Level Method
The Level method determines which options are available for setting the grid editor contour level properties. Available options are Simple, Logarithmic, and Advanced. Simple allows basic options to be set. These are discussed below. Logarithmic uses a log(10) interval to display the contours. These are also discussed below. Advanced allows individual lines to have z-level and line properties set individually. These options are explained on the Contour Levels - Grid Editor topic. To set the Level method, click on the existing method and select the desired method from the list.
Minimum Contour
Set the Minimum contour to the value of the first contour line you want displayed in the grid editor. To set a new value, highlight the existing value and type the new value. Press ENTER on the keyboard or click another command in the Properties window for the value to be applied. Values are in map Z units. When the Level method is set to Logarithmic , the Minimum contour value must be greater than 0.
Maximum Contour
Set the Maximum contour to the value of the last contour line you want displayed in the grid editor. To set a new value, highlight the existing value and type the new value. Press ENTER on the keyboard or click another command in the Properties window for the value to be applied. Values are in map Z units.
Contour Interval
The Contour interval option is available when the Level method is set to Simple . The Contour interval defines the spacing units between adjacent contour lines. This will affect how many contours appear in the grid editor and how close those contours are to one another. To set a new value, highlight the existing value and type the new value. Press ENTER on the keyboard or click another command in the Properties window for the value to be applied. Values are in map Z units.
Surfer uses the Contour interval , the Minimum contour value, and the Maximum contour value to determine how many contour lines are created on the map. Surfer will issue a warning message if the number of contour lines increases above 5000. Click OK in the warning message and alter the Contour interval , the Minimum contour value, or the Maximum contour value so that the total number of lines is less than 5000.
Default Levels
The Default levels option is available when the Level method is set to Simple. If the Minimum contour, Maximum contour, or Contour interval has changed, you can return to the Surfer default values by clicking the ![]() button next to Default levels. Surfer returns the Minimum contour, Maximum contour, and Contour interval to reasonable values.
button next to Default levels. Surfer returns the Minimum contour, Maximum contour, and Contour interval to reasonable values.
Major Contour Every
The Major contour every option is available when the Level method is set to Simple. The Major contour every option sets the frequency for how often a major contour line appears on the map. Major contour lines and minor contour lines can have different line properties. By default, the first line is the Minimum contour. The Major contour every value tells the program how many contour lines to skip before the next major contour line. If the Major contour every value is set to 1, every contour line is a major contour line. If the value is 2, every other line is a major contour line. If the value is 3, every third line is a major contour line, and so on.
Minor Levels Per Decade
The Minor levels per decade option is available when the Level method is set to Logarithmic. The Minor levels per decade controls how many minor contour lines appear between major contour lines. When the Level method is set to Logarithmic, the major contour lines occur at multiples of 10 (0.001, 0.01, 0.1, 1, 10, 100, 1000, 10000, etc.). The number of contour lines between each major contour line is set by the Minor levels per decade. To change the Minor levels per decade, highlight the existing value and type a new value. Press ENTER on the keyboard to make the change. Alternatively, click the ![]() to increase or decrease the value. The default value is 8.
to increase or decrease the value. The default value is 8.
If the value is 8, minor contour lines appear at 2, 3, 4, 5, 6, 7, 8, and 9 between 1 and 10 or 20, 30, 40, 50, 60, 70, 80, and 90 between 10 and 100. 8 is the most common number of minor contour lines per major. Any value between 0 and 500 can be specified, though. Some common levels are defined below, with the values of the contour lines that would appear.
|
Minor Levels per Decade |
Values of Contour Lines |
|
8 |
1, 2, 3, 4, 5, 6, 7, 8, 9 |
|
7 |
2.125, 3.250, 4.375, 5.500, 6.625, 7.750, 8.875 |
|
5 |
2.5, 4.0, 5.5, 7.0, 8.5 |
|
4 |
2.8, 4.6, 6.4, 8.2 |
|
3 |
3.25, 5.5, 7.75 |
|
2 |
4, 7 |
|
1 |
5.5 |
|
0 |
no minor lines are displayed |
Contour Levels
When the Level method is set to Advanced, the Contour levels option is available. Click the Edit Levels button to open the Contour Levels dialog, where the advanced level options are set.