Post Layer General Properties
To edit a post map, click once on the post map to select it. In the Properties window, click on the General tab. The post map properties General page contains the following options:
|
|
|
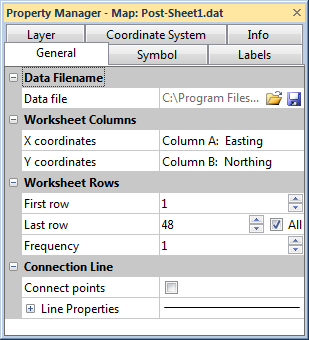
Change post map properties in the Properties window on the General page. |
Data File
The Data file displays the current file used in the post map. If the entire file name is not shown, place the mouse over the file name. A small window will appear with the full path and name displayed.
Change File
Click the ![]() button to display the Open Data dialog. This allows a new or updated data file to be specified for the post map. Select the new data file and click Open to reference the new file.
button to display the Open Data dialog. This allows a new or updated data file to be specified for the post map. Select the new data file and click Open to reference the new file.
Coordinate System Note
Regardless of the file selected with either the Map Tools | Reload | Map Data command or by clicking the ![]() button in the Properties window, the coordinate system for the original map layer is used after updating the file. If this is not the correct coordinate system, click on the map layer to select it. In the Properties window, click on the Coordinate System tab and set the coordinate system to the appropriate new system.
button in the Properties window, the coordinate system for the original map layer is used after updating the file. If this is not the correct coordinate system, click on the map layer to select it. In the Properties window, click on the Coordinate System tab and set the coordinate system to the appropriate new system.
Save File
Click the  button to display the Save As dialog. This allows the data file used for the post map to be saved to a new name. Set the File name, Save as type, and click Save. If a coordinate system has been defined on the Coordinate System tab in the Properties window, the Export Options dialog appears. Check the desired file formats. It is recommend that GS Reference (Version 2) file option be checked to generate a .GSR2 file. Click OK and the file is saved.
Worksheet Columns
The Worksheet Columns section specifies the columns to be used from the data file.
X and Y Coordinate Columns
Set X coordinates and Y coordinates to the columns containing the X and Y coordinates, respectively. If an empty cell is encountered in either of these columns, the corresponding point is excluded from the map. To change the column, click on the existing column name and select the new column from the list.
Worksheet Rows
The Worksheet Rows section specifies the rows to be used from the data file.
First Row
Set the First row to the first row in the worksheet for which you want a posted symbol to be displayed. The default value is 1, which will start at the first numeric row of data in the worksheet. To change the first row, highlight the existing row number and type a new row number. Alteratively, click the ![]() to increase or decrease the first row value.
to increase or decrease the first row value.
Last Row
Set the Last row to the last row in the worksheet for which you want a posted symbol to be displayed. The default is the last row of data in the worksheet. To change the last row, highlight the existing value and type a new value. Alteratively, click the ![]() to increase or decrease the last row value.
to increase or decrease the last row value.
To return to showing all of the rows in the worksheet, check the All box. If the First row is set to 1 and the Last row is set to All, all of the rows of data in the worksheet will be used.
Frequency
Use the Frequency setting to control how often data points are posted. A frequency of 1 posts every point. A frequency of 2 posts every other point, 3 posts every third, etc. This is often used to reduce the number of displayed data points to avoid symbols overwriting each other.
Exclusion Filter
The Exclusion Filter allows a Boolean expression to specify how to exclude data. The Exclusion Filter can be used with any column in the worksheet that contains numbers. Columns in the worksheet that contain text or columns that are empty will not be excluded by the Exclusion Filter.
To use one of the X, Y, or Z columns, use X, Y, or Z in the Exclusion Filter . To use another column from the worksheet, use _A, _B, _C, etc. The underscore is required when specifying a worksheet column.
For example:
|
X=-999 or Y=-999 or Z=-999 |
Excludes any data with a -999 value in either the X, Y, or Z columns. |
|
X<10 or X>20 or Y<10 or Y>20 |
Excludes all data except for points in the range 10 to 20 for both the X and Y directions. |
|
Z < 0.0 |
Excludes any triplet with Z value less than 0.0. |
|
_A > 10 |
Excludes any row in the worksheet that contains a value greater than 10 in column A. |
|
Z < 0 AND _D = -999 |
Excludes any triplet with Z value less than 0.0 and whose row in the worksheet contains a value in column D equal to -999. |
Boolean expressions, used by Grids | New Grid | Function, Grids | Calculate | Math, Grid | Data, and Grid | Variogram, include:
- logical operators (and, or, xor, not)
- comparison operators (=, <>, <, >, <=, >=)
- the IF function - for example IF(condition,
The words AND, OR, XOR, NOT, and IF are reserved keywords and may not be used as variable names.
To use a stored function, click the ![]() next to the current function. This will display the ten most recent functions used. The functions are stored in the registry, so the equations are stored between Surfer sessions. You can also start typing the function in the function box. If the function is in the ten function history, the entire function will auto-complete.
next to the current function. This will display the ten most recent functions used. The functions are stored in the registry, so the equations are stored between Surfer sessions. You can also start typing the function in the function box. If the function is in the ten function history, the entire function will auto-complete.
For example, consider the case of ignoring data outside of a grid. The original grid X Maximum is 50, but the grid X Maximum is reset to 40. To limit the search to data with X values less than 40, use the Exclusion Filter by entering X > 40 into the Exclusion Filter text box. This tells Surfer to exclude all data with X values greater than 40.
Consider a second case where data contains a numerical identifier in column D. When the value in this column is equal to -999, the data point is considered inaccurate and should not be used when gridding. To grid only those data where column D is not equal to -999, exclude column D with the Exclusion Filter by entering _D = -999 into the Exclusion Filter text box. This excludes all rows of data where column D contains the value -999.
Connection Line
The Connection Line section controls the line that connects points in the post map.
Connect Points
Check the box next to Connect points to connect all points in the post map layer with a line. Uncheck the box to remove the line from the post map layer. When the Connect points box is checked, points are connected in the order the points appear in the worksheet.
The line is drawn below the points. With open symbols, this can cause the line to appear inside the symbol. If the line should not be drawn through the symbol, use a closed symbol with the Fill color set to white instead of the open symbol.
Line Properties
Click on the ![]() next to Line Properties to set the connecting line properties. The Style, Color, Opacity , and Width can be set.
next to Line Properties to set the connecting line properties. The Style, Color, Opacity , and Width can be set.