TXT Formatted Text Grid [FTG, CSV, DAT, TXT] File Description
Formatted Text Grid [.FTG, .CSV, .DAT, .TXT] files are regularly spaced tables or matrices of Z values. Import a Formatted Text Grid file with the Open Grid dialog. The Open Grid dialog is accessed via one of the grid-based map layer commands (e.g. Home | New Map | Contour Map) or an applicable Grid tab command.
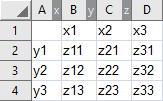
Surfer can import Formatted Text Grid files with a number of matrix formats. Below are four examples of possible formats. The first example shows tables where the first row and column contain information about the X and Y coordinates.
|
|
|
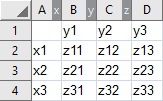
In the above images, the first row and column contain X or Y axis coordinates. In the image on the left the X coordinate advances by column. In the image on the right the X coordinate advances by row |
|
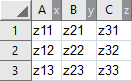
In the following example shows tables where all values in the table represent a Z value, and X and Y coordinate information is not included in the first row or column.
|
|
|
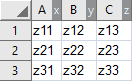
In the above images, X and Y coordinate information is not included in the first row and column. In the image on the left, the X coordinate advances by column. In the image on the right, the X coordinate advances by row. |
|
When the first row and column do not contain coordinate information, it is necessary that the first data value corresponds to the x-axis and y-axis minimum coordinates. If the table is not formatted with the value corresponding to the smallest x-axis and y-axis coordinate in the first row and column, then one of two manipulations must be performed. Either add a first row and first column with coordinate information, or reformat the table where the first data value is the Z value at the x-axis and y-axis minimums.
The Formatted Text Grid file must contain a rectangular, regularly spaced matrix of values. The x-axis coordinates and y-axis coordinates must increase by an equal incremental value with each row or column. However, the incremental value does not need to be the same for the x-axis and y-axis.
|
|
|
Above is an example of a regularly spaced Formatted Text Grid |
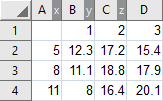
In the preceding image the Formatted Text Grid file includes x-axis coordinate information in the first row and y-axis information in the first column. The x-axis coordinate minimum is 1 (Column B) and increases by the step value of 1 in Columns C and D. The y-axis minimum is 5 (Row 2) and increases by the step value of 3 in Rows 3 and 4.