Three-Minute Tour
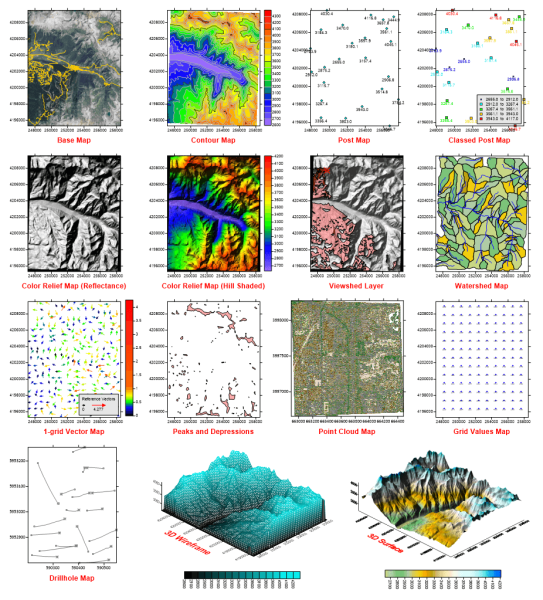
We have included several sample files with Surfer so that you can quickly see the variety of Surfer's capabilities. Only a few files are discussed here, and these examples do not include all of Surfer's many map types and features. The Contents window is a good source of information as to what is included in each Surfer file. The different types of maps that can be created is found in the program help in the Map Types topic.
|
| Surfer, a powerful contouring, gridding, and surface mapping package, produces publication-quality maps. Virtually all aspects of your maps can be customized to produce the exact presentation you want. |
To access the sample files from your computer:
- Open Surfer.
- Click the File | Open command.
- In the Open dialog, navigate to the Surfer Samples folder located in C:\Program Files\Golden Software\Surfer\Samples by default.
- Select the sample .SRF file of interest and click Open. The sample file is now displayed. Repeat as necessary to see the files of interest.
Examples of Surfer Capabilities
|
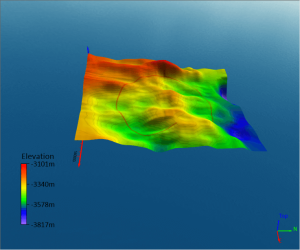
View Data in 3DExplore the capabilities of 3D View with our sample files, showcasing 3D contours, points, vector objects, drillholes, and volumes. To see these in 3D, open the SRF file, select the map in the Contents window, and then click Map Tools | View | 3D View. The 3DView.SRF file also contains a flight path you can experience by clicking 3D View | Fly-Through | Play within the 3D View window. |
|
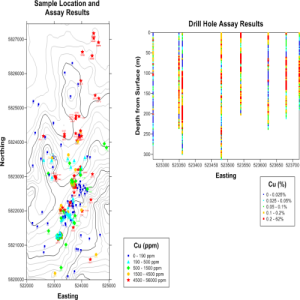
Present Scientific ResearchThe Classed Post.SRF sample file features two maps. The left map combines both a contour map and a classed post map layer, illustrating copper sample locations (in parts per million) and assay results within a study area. The map on the right is a classed post map that visualizes drillhole assay results, showing data values at specific depths relative to their Easting coordinates. Both maps include a classed post map legend.
|
|
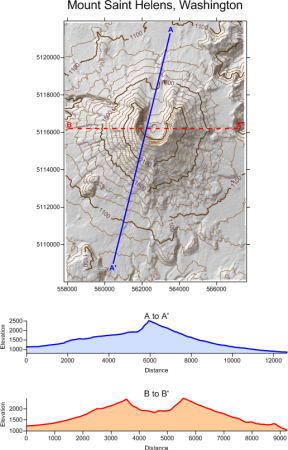
Display Complex Spatial DataThe Profile.SRF file contains a map with two base map layers, a contour layer, and a shaded relief layer. The base maps were created with the Map Tools | Add to Map | Profile command. At the bottom of the page, the A and B profile lines are displayed, showing two elevation profiles across the Mount St. Helens map. |
|
|
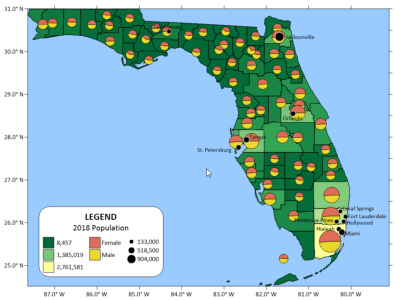
Layer Multiple Types of DataThe BaseSymbology(PieChart).SRF sample file was created from one post layer and two base layers. The post layer displays circular symbols relatively sized according to population count in various cities throughout Florida. The base layer depicts population in all the counties in Florida using Unclassed Colors symbology. The Pies base layer uses Pie Chart symbology to depict the proportion of women to men in each county. |