Viewing Maps in 3D
The 3D View window can help provide clarity when examining at complex information. This is especially useful when sharing results with an audience that isn't used to interpreting 3D information from a 2D map.
To explore your finished map in 3D:
-
Click the Map in the Contents window to select it.
-
Click Map Tools | View | 3D View
By default, Surfer will create a 2D Grid Surface from each grid file used in the map; a Vector Data object from each contour, post, vector base, and drillhole layer; and a 3D Point Cloud from each point cloud layer. Every layer in the map frame can be overlaid on each 2D Grid Surface.
The first thing we'll do is tell Surfer which data column should be used to position the points in the 3D model.
-
In the Contents window, click the Post-Well_measurements.xlsx layer under Vector Data to select it.
-
Click the Z Coordinate tab in the Properties window.
-
Click in the Z coordinates field and select Water-level elevation, in feet.
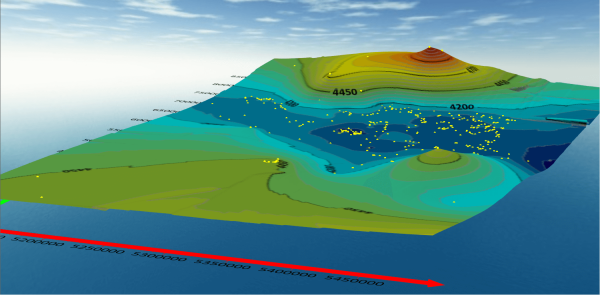
Click the Map Tools | View | 3D View command to view a map in 3D. Use the mouse to zoom in and out and reposition the 3D image.
Now that all of the data from our map is being modeled accurately, we can adjust some of the 3D View properties.
- Click Environment in the Contents window.
- Click the General tab in the Properties window.
- Set the Vertical exaggeration to 50.
A vertical exaggeration of 1 will provide a true representation when the X, Y and Z coordinates all use the same units of measurement as is true in this case. We're choosing to exaggerate the Z values because the groundwater basin being modeled here is relatively flat and we want to be able to see the areas of elevation and depression clearly.
- Click the Lighting tab in the Properties window
- Click in the Location field and select Fixed.
- Select the 2D Grid Surfaces in the Contents window.
- In the Properties window, set the Surface quality to 100 by using the slider or by typing 100. The lower the surface quality the more likely it is vector objects can appear to intersect the surface, even in places they should not. If your PC's performance becomes slow, reduce the Surface quality until acceptable speeds are restored.
- Select the Well_meansurements.grd surface in the Contents window.
- In the Textures to Display section of the Properties window, clear the Post-Well_measurement.csv option.
|
| Use the 3D View to explore for meaning in your data. |
With Surfer's 3D View you can add even more information to your models to ensure every audience can understand your results. For example, a map like this might benefit from the addition of a ground level surface to better illustrate the depth of the water relative to the ground. We could also add a drillhole map to illustrate the depth of water relative to the depth of each well. Seismic data slices could also be added to illustrate how the subsurface geology is impacting groundwater levels.
The final step in our map making journey will be to share these results.
Back to Changing Map Properties
Next to Sharing Your Work