Vector Map Symbol Properties
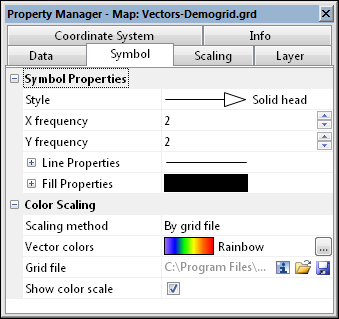
To edit a 1-grid vector map or 2-grid vector map, click once on the vector map to select it. The properties for the vector map are displayed in the Properties window. The vector map Symbol page contains the following options for the vector symbol drawn at each grid node:
|
|
|
Change vector symbol properties in the Properties window on the Symbol page. |
Style
The Style list contains several symbols to use to display the vectors. To change the symbol Style , click on the existing style. A list appears. Click on a new symbol from the list and the map automatically updates to show the new symbol.
Frequency
The X frequency and Y frequency settings control the number of symbols displayed on the vector map. If the frequency is set to one, every symbol is displayed on the vector map. If the frequency is set to two, every other symbol is displayed. If the frequency is set to three, every third symbol is displayed on the vector map, and so on. The symbols are located at grid nodes. So, skipping symbols skips vectors at the specified number of grid nodes in the X or Y direction. If there are too many symbols on the vector map, increase the X frequency and Y frequency numbers until the map becomes legible. To change the frequency, highlight the existing value and type a new number. Press ENTER on the keyboard or click anywhere else in the Properties window to make the change. Alternatively, click the ![]() buttons to increase or decrease the frequency.
buttons to increase or decrease the frequency.
Line Properties
Click on the ![]() next to Line Properties to open the line properties section. The Line Properties control the line on the outside of a filled symbol. If the Scaling method is set to By magnitude or By grid file , the Line Properties indicated in this section are not used.
next to Line Properties to open the line properties section. The Line Properties control the line on the outside of a filled symbol. If the Scaling method is set to By magnitude or By grid file , the Line Properties indicated in this section are not used.
Fill Properties
Click on the ![]() next to Fill Properties to open the fill properties section. The Fill Properties control the color and patter of the area inside a filled symbol. If the Scaling method is set to By magnitude or By grid file, the Fill Properties indicated in this section are not used.
next to Fill Properties to open the fill properties section. The Fill Properties control the color and patter of the area inside a filled symbol. If the Scaling method is set to By magnitude or By grid file, the Fill Properties indicated in this section are not used.
Color Scaling
The Color Scaling section contains options for gradationally coloring the symbols.
Scaling Method
The Scaling method determines how to gradationally color the vector map symbols. To change the Scaling method, click on the current method. A list appears. Select the desired method and the map is updated.
-
When the Scaling method is set to Disabled, the Line Properties and Fill Properties specified in the Symbol Properties section are used to color the vector symbols.
-
When the Scaling method is set to By magnitude, the vectors are gradationally colored, by the length of the vector.
-
When the Scaling method is set to By grid file, the vectors are gradationally colored by the value in another grid file. The grid file must contain the same output grid geometry as the vector map grid files. This means the number of rows and columns and the grid range must be the same for all grids. The vectors are colored according to the corresponding Z value in the color grid file.
Vector Colors
The Vector colors option defines the colormap used to fill the vector map symbol when Scaling method is set to either By magnitude or By grid file. Change the color by clicking the existing color bar next to Vector colors. Select the new colormap from the list. If the desired color map is not listed, click the ![]() button to the right of the selected colormap. The Colormap Editor appears. Make any changes and click OK to see the change on the map. The range for the colors is also set from the Colormap Editor. To set the colormap to use a logarithmic scale, click the
button to the right of the selected colormap. The Colormap Editor appears. Make any changes and click OK to see the change on the map. The range for the colors is also set from the Colormap Editor. To set the colormap to use a logarithmic scale, click the ![]() button to the right of the selected colormap. Check the Logarithmic scaling option and click OK. The color map is automatically updated to show logarithmic scaling.
button to the right of the selected colormap. Check the Logarithmic scaling option and click OK. The color map is automatically updated to show logarithmic scaling.
Grid File
The Grid file displays the path and file name for the grid file used to color the vector symbols when the Scaling method is set to By grid file. If the entire file name is not shown, place the mouse over the file name. A small window will appear with the full path and name displayed.
Grid Information
The ![]() button displays information about the grid file used to produce the map layer. The information includes the grid size, the minimum and maximum X, Y, Z, and C values contained in the grid file, and statistics. If the grid file contains more than 40 million nodes, you are asked if you wish to create a detailed report or a quick report. Click Yes in the message to create a detailed grid report, or click No to create a shorter quick grid report.
button displays information about the grid file used to produce the map layer. The information includes the grid size, the minimum and maximum X, Y, Z, and C values contained in the grid file, and statistics. If the grid file contains more than 40 million nodes, you are asked if you wish to create a detailed report or a quick report. Click Yes in the message to create a detailed grid report, or click No to create a shorter quick grid report.
Change File
Click the  button to display the Open Grid dialog. This allows a new or updated grid file to be specified for the vector symbol colors. Select the new grid file and click Open to reference the new file. If a new unreferenced file is selected, select the appropriate coordinate system in the Assign Coordinate System dialog and click OK.
Save File
Click the  button to display the Save Grid As dialog. This allows the grid file used to be saved to a new name. Set the File name, Save as type, and click Save to save the file.
Show Color Scale
The Show color scale option permits the display of a color scale bar adjacent to the map. The color scale bar indicates the colors assigned to the vector symbols on the map, and the associated Z level values are displayed as labels on the color scale bar. When the Show color scale box is checked, the color scale bar is displayed. If the colormap is set to a logarithmic scale, the color scale bar will automatically display logarithmic scaling.